
In previous pieces, I have noted how traders and investors continued to load up on call options on Apple (AAPL) despite its persistent decline off all-time highs (for example see Bullish Earnings Trading Patterns and Sentiment Collide With Apple’s Recent Downtrend). It seems sentiment has finally taken a dramatic turn commensurate with the dramatic turn in Apple’s stock.
In after-hours trading immediately following earnings, AAPL soared to about $432, the strong bull/bear dividing line, only to fade completely and end after hours around $400. Regular trading opened with a gap down to about $393. Buyers immediately stepped into the breach, managing to get AAPL to $415 before (presumably) profit-taking closed the stock out almost right where it closed before earnings. It seemed like a fruitless day until AAPL managed to gain a little under 1% the next day. From there, AAPL has traded up six out of the last 7 days (including today). Apple is now building a nice buffer on top of its 50-day moving average (DMA) and the $432 support line. The Bollinger Band is opening up, suggesting a sustained uptrend is underway that will certainly punch right through the March high at $470 in due time. In other words, AAPL’s trading action has all the look of a sustained bottom in the making.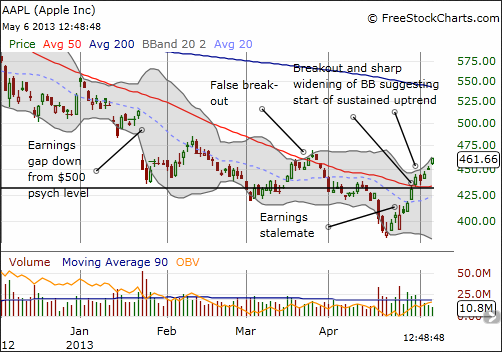
Source: FreeStockCharts.com
This kind of bottom did not seem possible with traders and investors constantly buying call options with the stock sliding week after week. Sure enough, AAPL’s 16-month low coincides with a retest of a multi-year low in the open interest put/call ratio. A few days before earnings, the open interest put/call ratio bounced sharply and has pushed higher along with the stock. I do not consider this an accidental relationship even with the open interest put/call ratio only sitting at the 53 percentile. For example, put buying in this case suggests that at least some stock holders are firming up their conviction to hold by buying protection for their portfolio rather than demonstrating their conviction by doubling and tripling down using call options.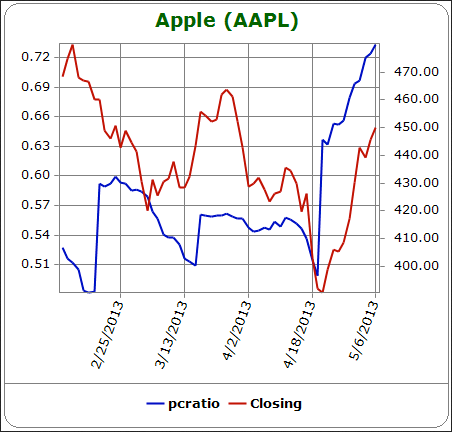
Source: Schaeffer’s Investment Research
Going forward, I will be watching this ratio much more closely. In the meantime, Apple’s reawakening is screwing up the daily trading patterns I updated in the pre-earnings trading plan. I think it makes sense at this point to just assume the stock is heading ever higher until either this put/call ratio turns southward again and/or the stock hits $500. $500 will be a MAJOR test as a round number level AND a fill of the major gap down from January earnings. By that point, the downward trending 200DMA will also loom directly overhead.
I will close with a related graphic for those of you familiar with Apple Bottom jeans…
A trader should not try to fit the stock, the stock should fit the trader…
Source: Apple Bottom’s
Be careful out there!
Full disclosure: long AAPL shares, call spreads, and puts
- English (UK)
- English (India)
- English (Canada)
- English (Australia)
- English (South Africa)
- English (Philippines)
- English (Nigeria)
- Deutsch
- Español (España)
- Español (México)
- Français
- Italiano
- Nederlands
- Português (Portugal)
- Polski
- Português (Brasil)
- Русский
- Türkçe
- العربية
- Ελληνικά
- Svenska
- Suomi
- עברית
- 日本語
- 한국어
- 简体中文
- 繁體中文
- Bahasa Indonesia
- Bahasa Melayu
- ไทย
- Tiếng Việt
- हिंदी
An Apple Bottom As Sentiment Turns South
Published 05/06/2013, 01:04 PM
Updated 07/09/2023, 06:31 AM
An Apple Bottom As Sentiment Turns South
Latest comments
Loading next article…
Install Our App
Risk Disclosure: Trading in financial instruments and/or cryptocurrencies involves high risks including the risk of losing some, or all, of your investment amount, and may not be suitable for all investors. Prices of cryptocurrencies are extremely volatile and may be affected by external factors such as financial, regulatory or political events. Trading on margin increases the financial risks.
Before deciding to trade in financial instrument or cryptocurrencies you should be fully informed of the risks and costs associated with trading the financial markets, carefully consider your investment objectives, level of experience, and risk appetite, and seek professional advice where needed.
Fusion Media would like to remind you that the data contained in this website is not necessarily real-time nor accurate. The data and prices on the website are not necessarily provided by any market or exchange, but may be provided by market makers, and so prices may not be accurate and may differ from the actual price at any given market, meaning prices are indicative and not appropriate for trading purposes. Fusion Media and any provider of the data contained in this website will not accept liability for any loss or damage as a result of your trading, or your reliance on the information contained within this website.
It is prohibited to use, store, reproduce, display, modify, transmit or distribute the data contained in this website without the explicit prior written permission of Fusion Media and/or the data provider. All intellectual property rights are reserved by the providers and/or the exchange providing the data contained in this website.
Fusion Media may be compensated by the advertisers that appear on the website, based on your interaction with the advertisements or advertisers.
© 2007-2024 - Fusion Media Limited. All Rights Reserved.