Tier 1 automotive parts supplier American Axle (NYSE:AXL) stock is slowly recovering back towards pre-COVID 19 levels. Shares underperformed the benchmark S&P 500 mostly from resonating effects of the pandemic. As COVID-19 caseloads start to retract as vaccine rollout accelerates, the auto industry is staging a sharp rebound.
The maker of drivetrain products are a direct beneficiary of the economic recovery and the electrification of vehicles. The electronic vehicle (EV) revolution will bolster revenue streams for the Company as its major clients including General Motors (NYSE:GM) and Ford (NYSE:F) bolster their investment in EVs. American Axle’s Electric Drive Technology now powers Jaguar’s first pure electric mode, supplying both front and rear e-Drive units. While shares are still trading below its 2020 pre-COVID levels, the recent surge can still provide opportunistic pullback levels for prudent investors to consider scaling into a position.
Q3 FY 2020 Earnings Release
On Oct.30, 2020, American Axle released its fiscal third-quarter 2020 results for the quarter ending September 2020. The Company reported adjusted earnings-per-share (EPS) of $1.15 excluding non-recurring items versus (-$1.10) EPS in Q3 2019. Revenues fell (-16.7%) year-over-year (YoY) to $1.41 billion. Adjusted EBITDA was $297.1 million, or 21% of sales. Net cash from operations was $249.5 million and adjusted free cash flow was $217.2 million. The Company provided full-year 2020 forecasts of revenues around $4.6 million, adjusted EBITDA ranging between $665 million to $680 million with adjusted free cash flow ranging between $220 million to $235 million.
Conference Call Takeaways
American Axle CEO, David Dauch, reiterated that negative impact of COVID-19 for the quarter was approximately $87 million. Additionally, sales for Q3 2019 included $155 million from the U.S. iron casting operations, which were sold in December 2019. This distinction should be noted in the YoY topline comparisons. Adjusted EBITDA was hit by $16 million from the effects of COVID-19 for the quarter. The Company ended the quarter with nearly $1.5 billion in liquidity. CEO Dauch summed it up:
“And with two more electric drive system launches and multiple electric powertrain component launches next year as well as many significant new business opportunities ahead, AAM is laser focused on paving the path towards profitable growth and an even brighter future… stay tuned for more developments in this electrifying area.”
Electric Vehicle Driveline Systems
American Axle is the global leader in driveline systems for full-size pickup trucks and SUVs and the largest automotive metal forger in the world. While combustion engine vehicles are still here to stay, the Company is actively transitioning to electric drive line solutions with several projects incorporating their Electric Drive programs in Europe and China. Electrification growth drivers include participation in commercial EV truck markets, electric powertrain components and developing advanced next-gen products. CEO Dauch addressed in the conference call:
“The only thing we can say now is we’ve got two vehicle programs in production today, we’ve got two additional electrification programs I’ll be launching next year, as well as some component support for electrification, our market baskets about $1.05 billion of new opportunities, of which nearly half of that is tied to electrification.”
He added:
“Clearly, there’s a sift from traditional product to more the electrification product. And we’re trying to position ourselves in the marketplace to win our fair share of the business.”
Markets are starting to price in a premium for legacy automotive parts suppliers transitioning for the EV markets. Prudent investors can monitor AXL for opportunistic pullback levels to gain exposure.

AXL Opportunistic Pullback Levels
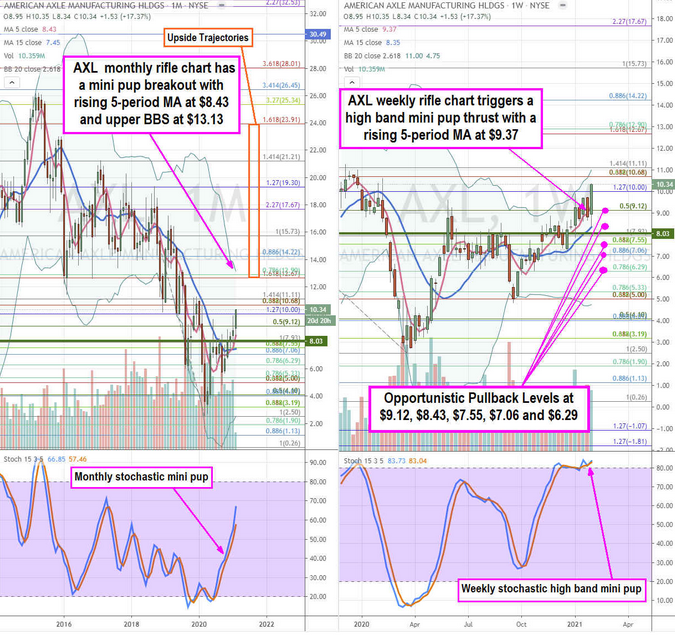
Using the rifle charts on the monthly and weekly time frames provide a broader view of the price action playing field for AXL stock. The monthly rifle chart triggered a monthly mini pup spike with a rising 5-period moving average (MA) at $8.43 grinding towards the monthly upper BBs near the $12.90 Fibonacci (fib) level. The monthly breakout formed on market structure low (MSL) buy trigger above $8.03. The weekly rifle chart formed a full oscillation up through the 80-band and triggered a high band mini pup on the thrust back above through the weekly 5-period MA at $9.37 as the upper BBs sit near the $11.11 fib. While a “late bloomer”, shares are elevated. Prudent investors can watch for a weekly 80-band stochastic crossover down to consider exposure at opportunistic pullback levels at the $9.12 fib, $8.43 monthly 5-period MA, $7.55 fib, $7.06 fib, and the $6.29 fib. The upside trajectories range from the $12.67 fib to the $23.91 fib.
