I have to be honest – I did not think Brexit had a chance. Apparently Wall Street didn’t either because trading on Friday was a disaster for equity markets around the world, with banks taking a particularly hard beating. There was a very clear flight to safety with defensive sectors like Utilities and precious metals outperforming. Speaking of precious metals, gold, silver, and the miners had a terrific day as you will see below.
The tide is turning folks. Equity markets, depending on how one measures valuation, are at or near all-time highs. Earnings have been declining for months and yet stocks continued to march higher (at least until yesterday). Precious metals have been bottoming for over a year as both fundamentals and technicals continue to tilt in the bull’s favor. In my post from Wednesday I commented, “I feel like there is going to be a huge move soon, possibly in [both equities and precious metals], but I have no idea which direction it will be.” Well, I think Brexit has given us the answer.
Today’s post will be chart-heavy with annotations and a few comments smattered about. My takeaway from Friday is nothing more than a confirmation of what I’ve been saying for over a year: equity markets are topping and precious metals are bottoming – it’s time to position yourself accordingly.
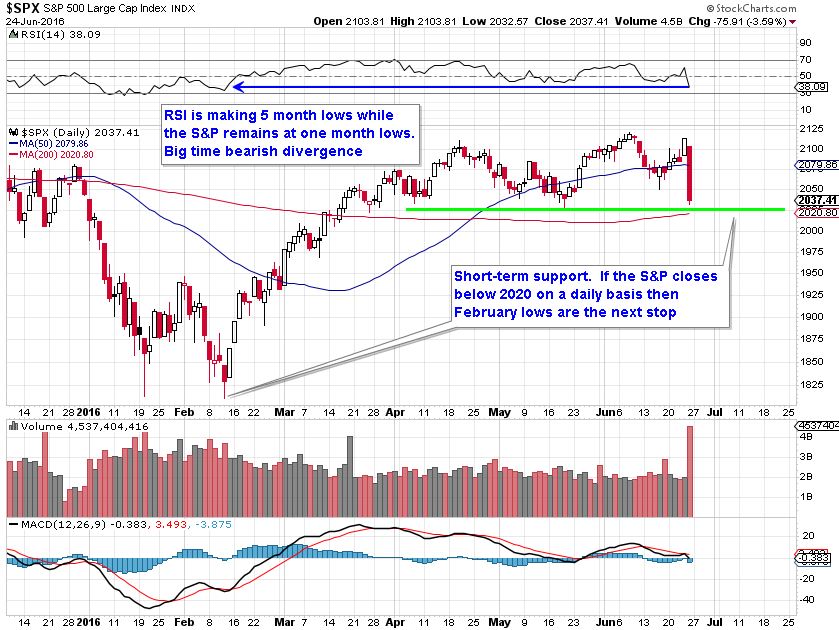
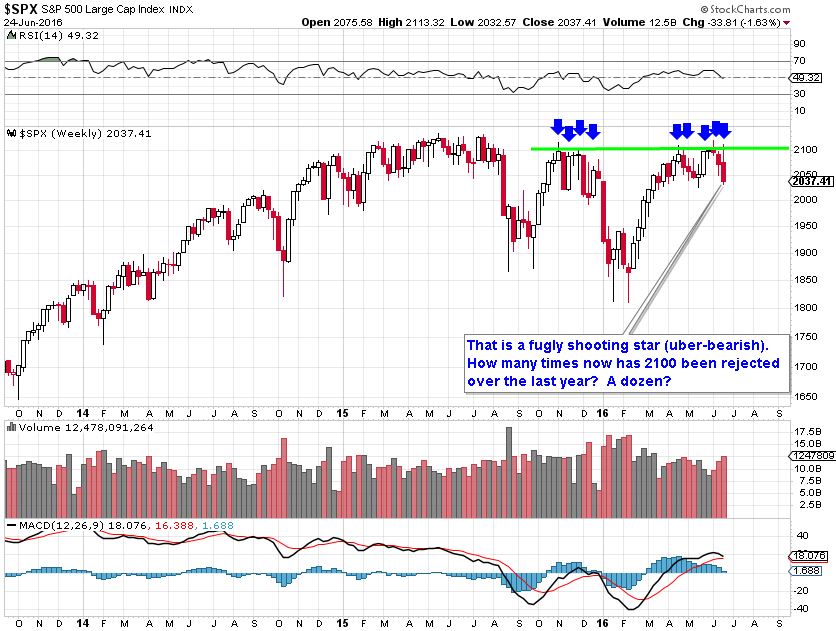
First up is a look at the S&P 500 daily and weekly charts. Friday did a ton of damage to the bullish thesis. If the 7-year bull market is still intact, it’s going to be a long, hard slog to repair what has happened in a single trading session. 2100 has become a very clear line of resistance – just check out the weekly chart to see what I mean.
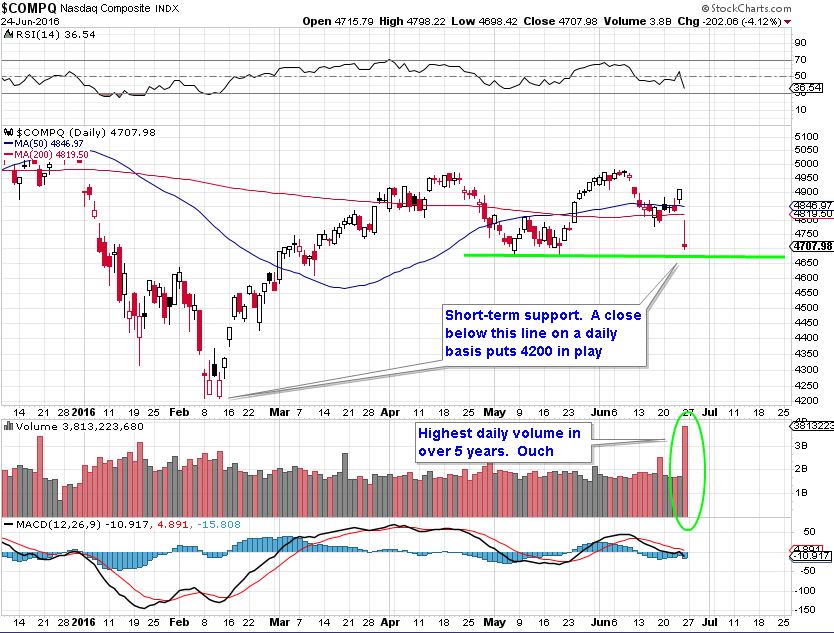
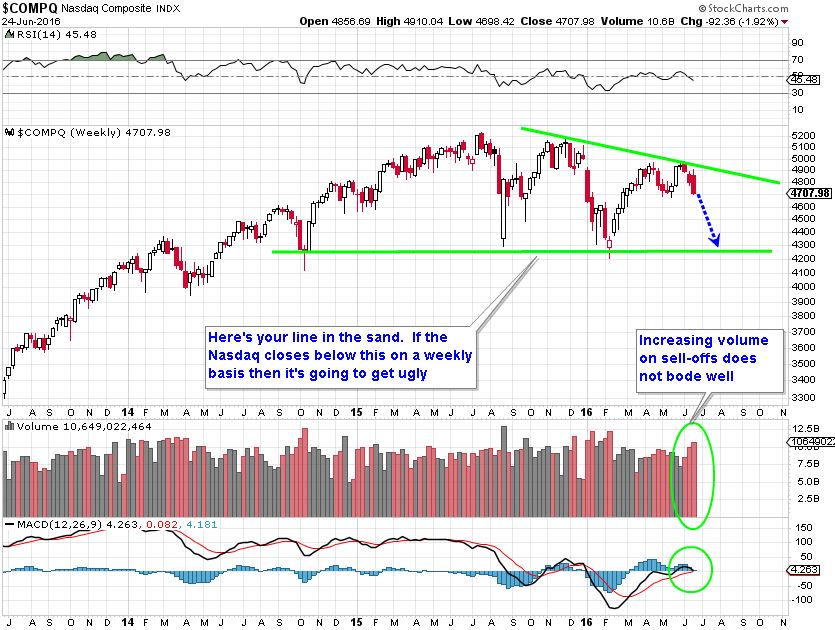
And on to the NASDAQ. Same story, different index. Down 4% in a single day with massive volume to boot.
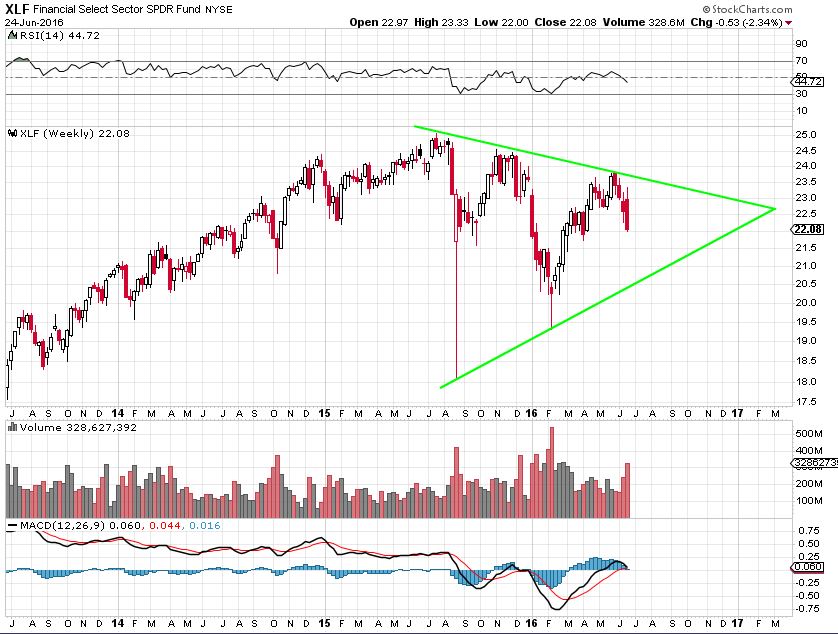
And a quick peek at Financial Select Sector SPDR (NYSE:XLF). Lots of room to fall to that lower line of support.
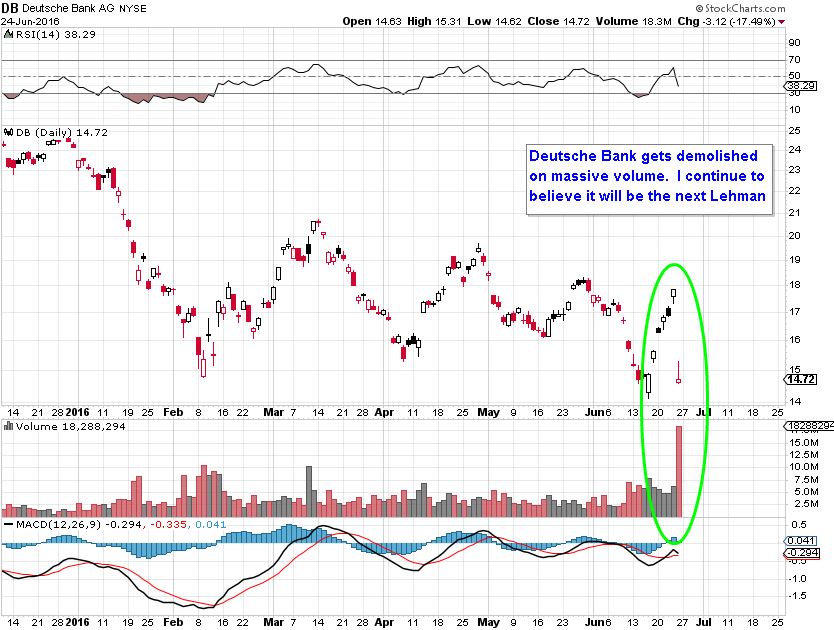
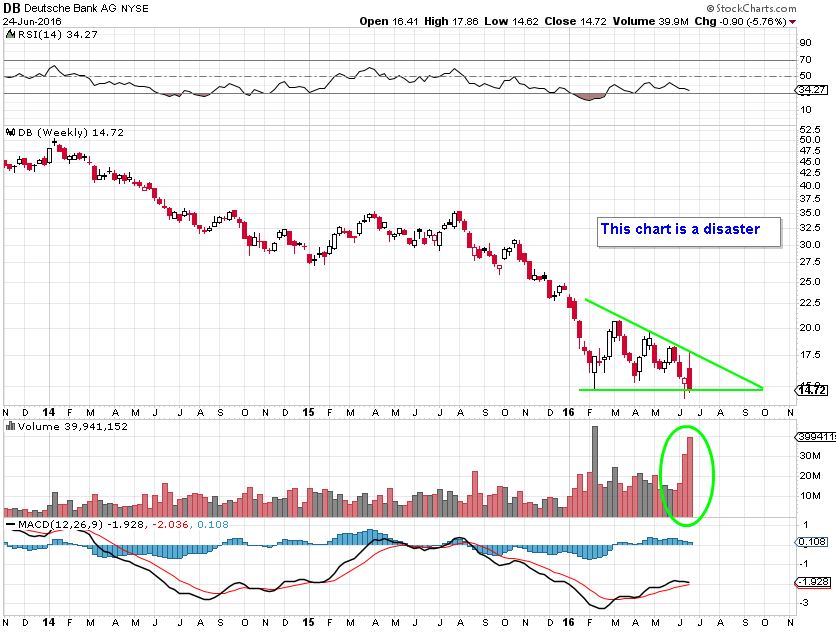
I specifically wanted to show you a couple charts of our old friend Deutsche Bank (DE:DBKGn). It’s now trading just pennies away from all-time lows. The word FUBAR comes to mind…
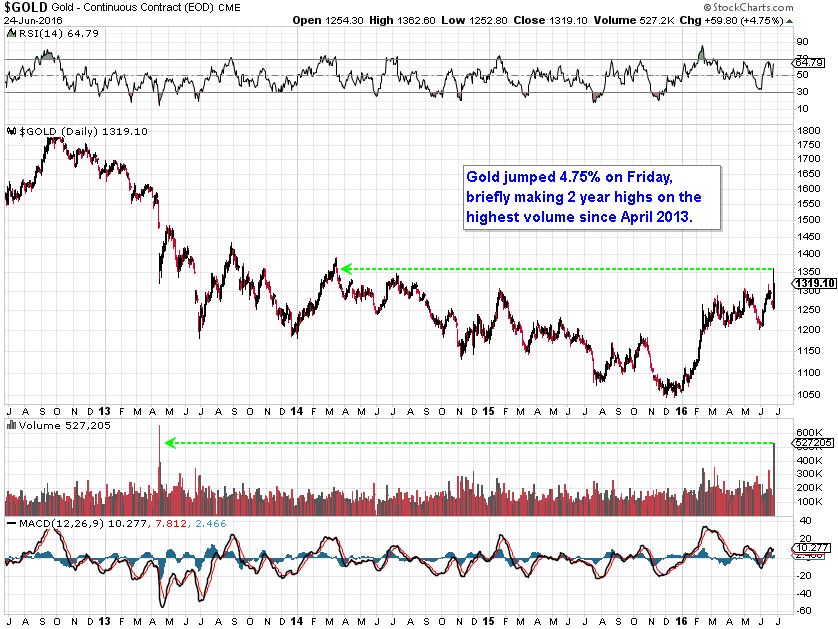
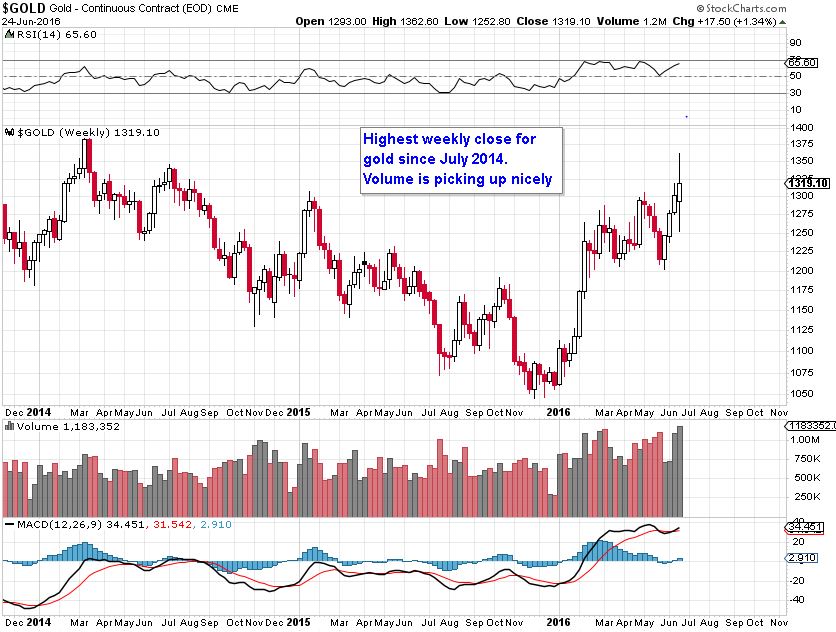
Now we head to the stars of Friday’s show: precious metals and miners. First, we start with gold.
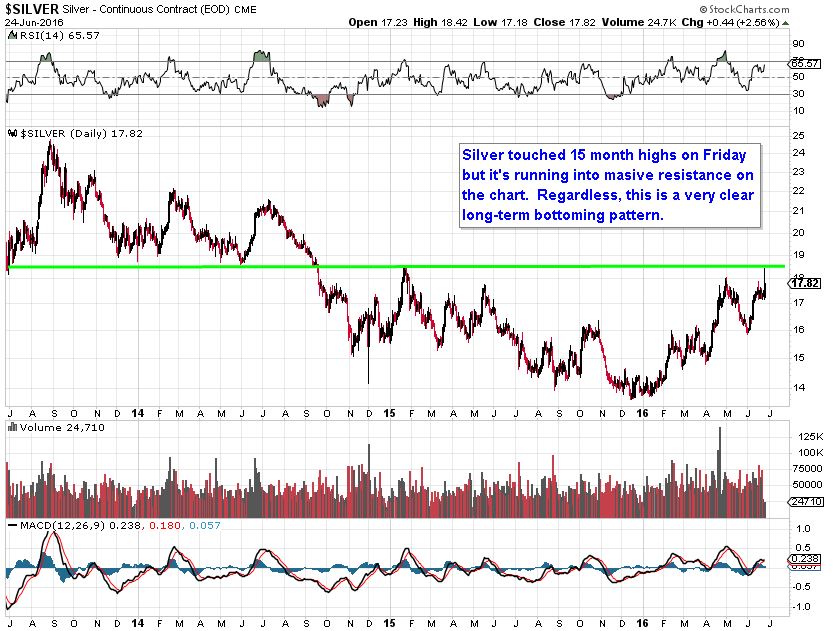
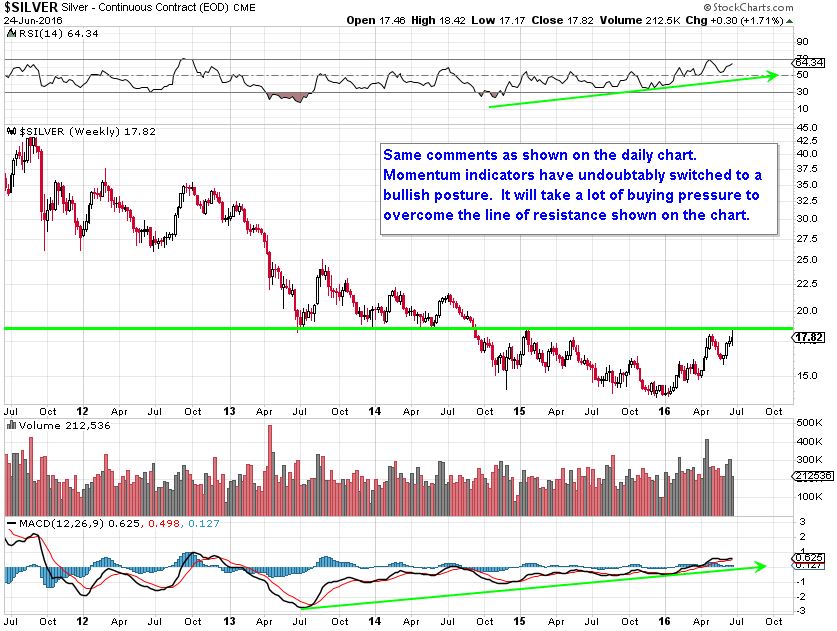
And now a look at gold’s more volatile sibling, silver. Silver’s move on Friday stopped right at big-time resistance. Look back at 2013 and 2014 and you’ll see that $18.50 provided support for a long time. Once that level was breached in September 2014, it became resistance with lots of overhead supply sitting on top. Also, I would like to note the curious lack of volume on Friday. Not sure what it means, if anything. Overall, silver continues to paint a very bullish picture on the charts.
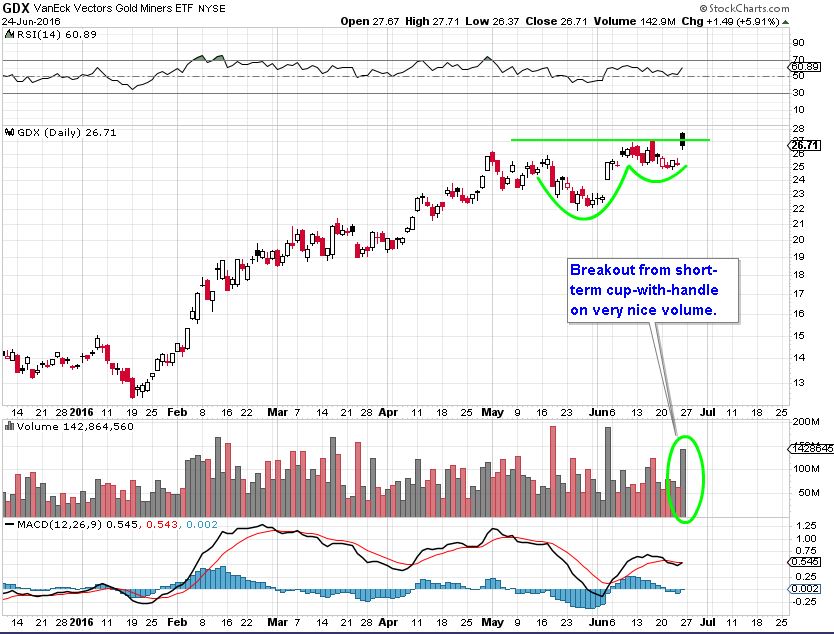
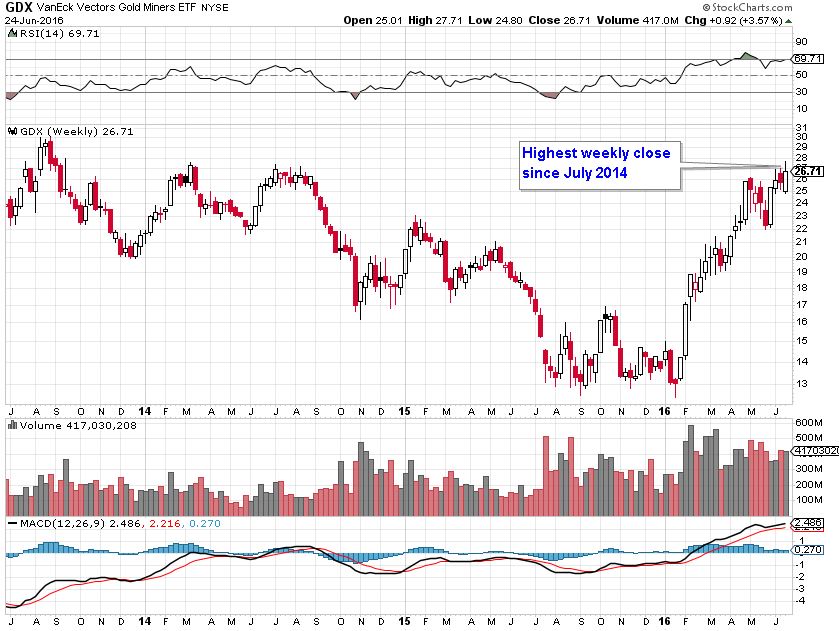
The gold miners continue to look good as well.
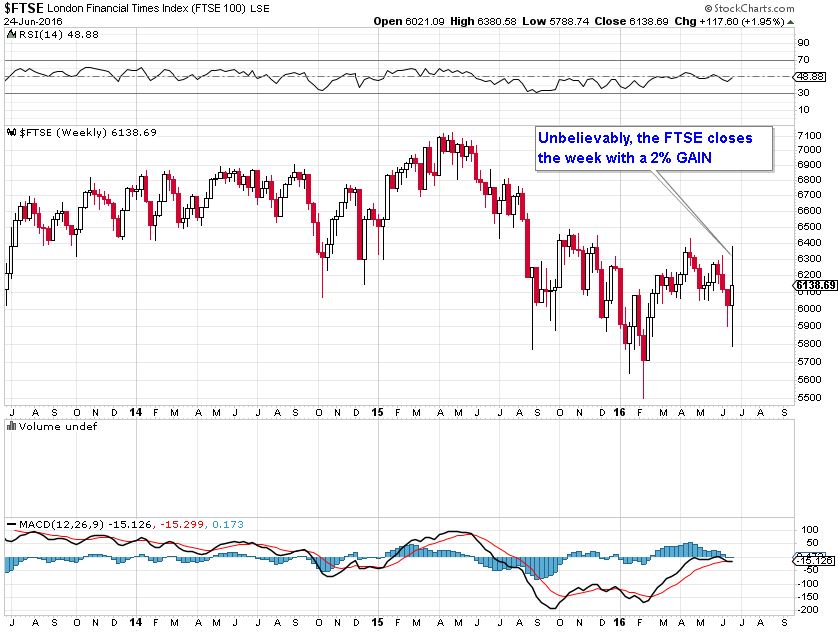
I’m going to end with the WTF chart of the day. Take a look at the FTSE weekly chart. If you’re not familiar with it, the FTSE is a share index of the 100 companies listed on the London Stock Exchange with the highest market capitalization. In other words, it’s very similar to the Dow Jones Industrial Average. Did you know that after Friday’s bloodbath the FTSE still gained 2% on the week?

