
Today the S&P 500 index fell 2.5% and at its low was more than 102 points lower than the all-time high of 1687.18 from May 22nd. At times like this I am amazed by how many requests I get to update the table of pullbacks I have been posting periodically since the current bull market began in March 2009.
As the table below shows, the current peak-to-trough decline represents a 6.1% pullback from the all-time high and ranks tenth of twenty-one pullbacks during this period. The mean pullback during this bull market is 7.0% and would suggest a bottom of SPX 1568. The median pullback is only 5.6% and would have brought the index down to 1593.
This is not to say that there is a specified amount of suffering that the bulls must be subject to before stocks should feel to rebound or that there is a certain amount of time that the bulls should spend in the penalty box (the mean peak-to-trough decline lasts 18 days, while the median is 7 days), but at some point the severity of the pullback will begin to attract more buyers and increase the odds that the tide will turn.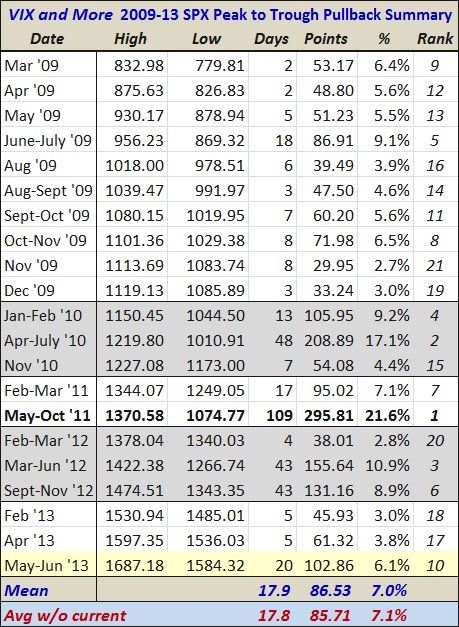
For those who prefer their data crammed into one graphic, I have also updated an annotated plot in which the y-axis captures the magnitude of the peak-to-trough decline (inverted) and the x-axis records the duration of that move. I have also included the peak VIX during the pullback as a red label for each dot and a long dotted black line as the best linear fit of all the data points.
Note that the current pullback is already the fifth longest in four plus years and while it has made quite a splash so far, there is only a 3.87 point cushion from today’s close to the intraday low before the pullback officially becomes longer in the tooth and more severe.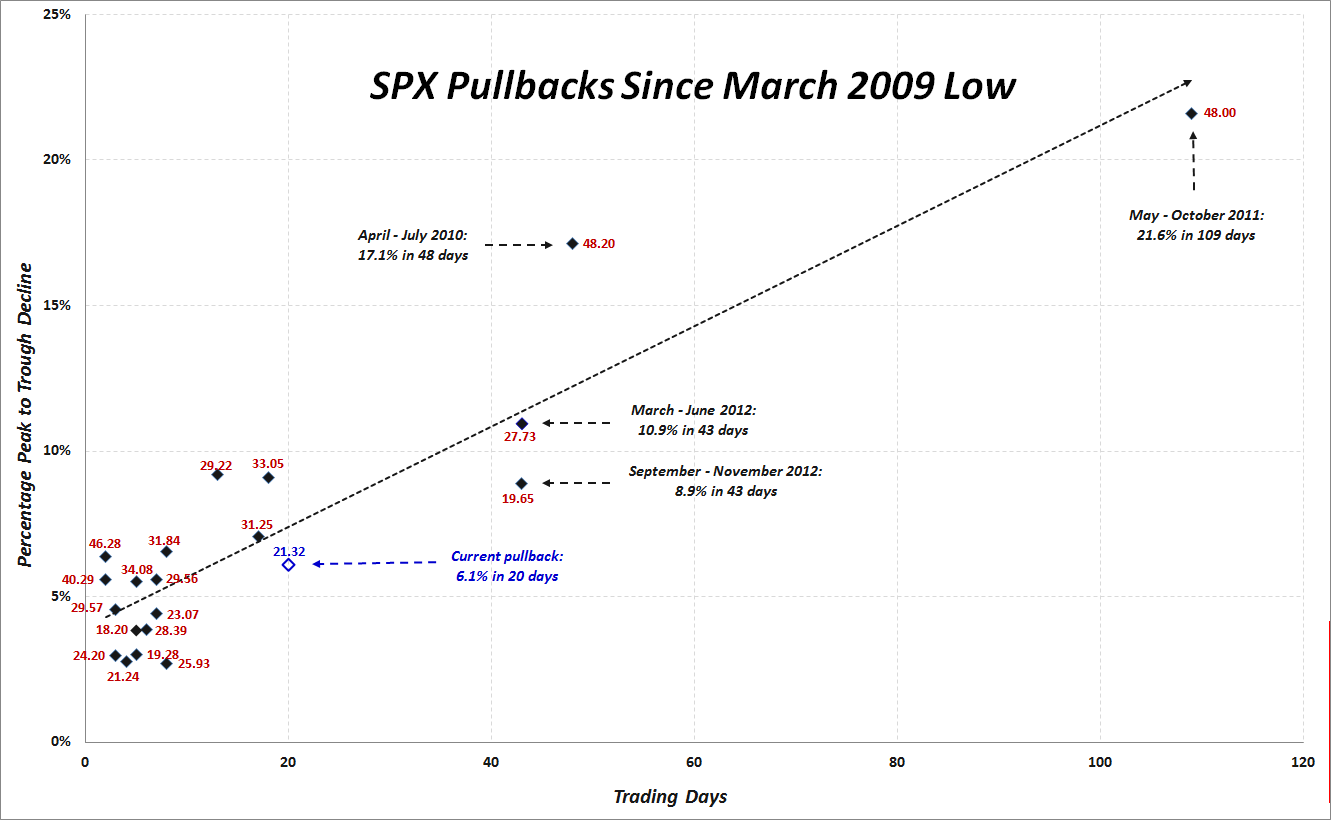
Disclosure(s): none
- English (UK)
- English (India)
- English (Canada)
- English (Australia)
- English (South Africa)
- English (Philippines)
- English (Nigeria)
- Deutsch
- Español (España)
- Español (México)
- Français
- Italiano
- Nederlands
- Português (Portugal)
- Polski
- Português (Brasil)
- Русский
- Türkçe
- العربية
- Ελληνικά
- Svenska
- Suomi
- עברית
- 日本語
- 한국어
- 简体中文
- 繁體中文
- Bahasa Indonesia
- Bahasa Melayu
- ไทย
- Tiếng Việt
- हिंदी
All About The Pullback From SPX 1687
Published 06/20/2013, 01:58 PM
Updated 07/09/2023, 06:31 AM
All About The Pullback From SPX 1687
Latest comments
Loading next article…
Install Our App
Risk Disclosure: Trading in financial instruments and/or cryptocurrencies involves high risks including the risk of losing some, or all, of your investment amount, and may not be suitable for all investors. Prices of cryptocurrencies are extremely volatile and may be affected by external factors such as financial, regulatory or political events. Trading on margin increases the financial risks.
Before deciding to trade in financial instrument or cryptocurrencies you should be fully informed of the risks and costs associated with trading the financial markets, carefully consider your investment objectives, level of experience, and risk appetite, and seek professional advice where needed.
Fusion Media would like to remind you that the data contained in this website is not necessarily real-time nor accurate. The data and prices on the website are not necessarily provided by any market or exchange, but may be provided by market makers, and so prices may not be accurate and may differ from the actual price at any given market, meaning prices are indicative and not appropriate for trading purposes. Fusion Media and any provider of the data contained in this website will not accept liability for any loss or damage as a result of your trading, or your reliance on the information contained within this website.
It is prohibited to use, store, reproduce, display, modify, transmit or distribute the data contained in this website without the explicit prior written permission of Fusion Media and/or the data provider. All intellectual property rights are reserved by the providers and/or the exchange providing the data contained in this website.
Fusion Media may be compensated by the advertisers that appear on the website, based on your interaction with the advertisements or advertisers.
© 2007-2024 - Fusion Media Limited. All Rights Reserved.