September has come and gone. The Fed was supposed to rock the world with a massive 25 basis-point rate increase, but Ms. Yellen blinked, and financial markets breathed a sigh of relief. Cheap money was still available to bloat stock values and fund the global banking casino of government bonds. What ever will the Press write about today? China has receded into the back pages. Mario Draghi, the omnipresent chairman of the ECB, has chosen to avoid the spotlight, strange behavior for him, for sure. The G20 confab was a non-event, but, as the dust settles and markets tread calmer waters, the maddening throngs are back to screaming that the sky is about to fall.
Yes, the doomsday pundits have grabbed the podium. Nature may abhor a vacuum, but I suspect that every “Little Boy Blue” in the world has regained new strength to shout from the rooftops that Armageddon is near. In the olden days, we would have mounted a mission to the Oracle (NYSE:ORCL) at Delphi in quest of answers. In the modern era, we prefer to approach academia and its Nobel-Prize winners in economics to pontificate where we are headed.
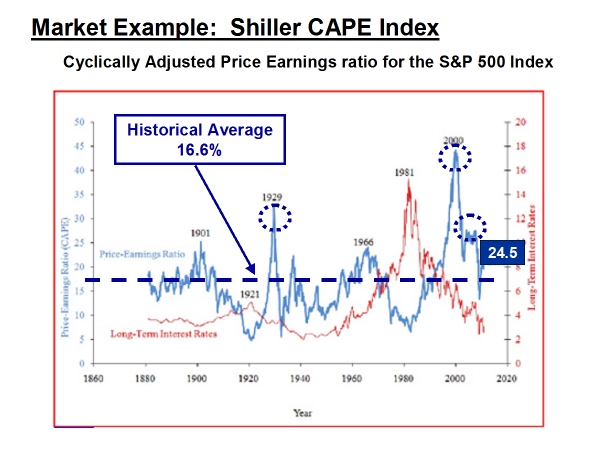
Robert Shiller’s famous CAPE Index chart could start a rush for the exits.

The famous oracle of Delphi had to inhale noxious gases, go into a trance, and then speak gibberish that only the local priests could interpret. Fast forward to today, and we observe interviews of respected icons speaking noxious gibberish that defy interpretation at any level. Finding correct and timely answers is the objective, the same as thousands of years ago, but such masters of the nether world are difficult to locate. There is one individual, however, that is willing to risk his reputation by making dire forecasts that could cause strong men to tremble and weak men to sell off their portfolios in a flash. That man is none other than Robert Shiller.
Financial markets form valuation bubbles over time. That is what they do, but, when the bubbles deflate, it is usually followed by financial catastrophes of the worst kind. Trying to prepare ahead of time in order to withstand the impending consequences is what drives the need for accurate forecasts. The forecaster may also be looking for a lifetime of glory and the opportunity to leverage his correct guess into substantial cash, but such is not the case with Shiller. He is a Yale economist in his late sixties that spends his days studying a multitude of charts and analyses, searching for truth for the next edition of his classic book, “Irrational Exuberance”.
Bubbles are all about over valuations, and the best indicator of this phenomenon is to follow Price/Earning ratios of the participants in the S&P 500 Index. The only problem was that companies have a way of playing games with their earnings figures, such that a reliable measure using P/E ratios was lacking, until Shiller made one modification. He took a 10-year average of earnings and used that figure for the denominator, thereby smoothing out most of the distortions caused by creative accounting. The result was his now famous “Cyclically Adjusted Price Earnings” (CAPE) ratio, as depicted above.
Current concerns are that today’s “24.5” index figure is just below the three highest values in history, which also happen to coincide with three major bubble deflations in the historical record – 1929, 2000, and 2007. Are your hairs standing on end? Did a ripple of fear suddenly pass through your consciousness? Yes, the past does seem to be repeating itself right before our very eyes, but is it correct to assume that a crash is imminent?
When asked why the index was tracking where it is, even the Nobel-Prize winner was unable to interpret his own chart with understandable economic gibberish. He once remarked to a reporter that, “I suspect the real answers lie largely in the realm of sociology and social psychology — in phenomena like irrational exuberance, which, eventually, has always faded before. If the mood changes again, stock market investments may disappoint us.”
Yes, the wise professor did couch his words with “may”, not “will” or some other more demonstrative word. We do live in unusual times. Central bankers around the world have been manipulating market forces for nearly a decade with low interest rate policies that stretch credulity beyond even the most conservative of levels. The addition of the Red line to the above chart reflects how long-term interest rates have trended over the entire period. Interest rates can definitely impact earnings, as well as market valuations, but to what degree? Like everyone else, Shiller and we must wait for the outcome to unfold.
Who is Robert Shiller, and why is he so credible?
One biographical source states that, “Robert James "Bob" Shiller (born March 29, 1946) is a 2013 American Nobel Laureate, economist, academic, and best-selling author. He currently serves as a Sterling Professor of Economics at Yale University and is a fellow at the Yale School of Management's International Center for Finance. Shiller is ranked among the 100 most influential economists of the world. His work, relating to the dynamics of asset prices, such as fixed income, equities, and real estate, and their metrics, has been influential in the development of the theory, as well as its implications for practice and policy making.”
Shiller is definitely a man to be trusted. He is often interviewed for his opinions on the economy, especially in the areas of stock market valuations and the housing sector. Here are a few more reasons why reporters are so eager to kneel before him:
- Shiller is widely known for his CAPE Index, but he is actively followed by the housing industry where the focus is always on another of his collaborative creations, the multiple Case–Shiller home price indices: A national home price index, a 20-city composite index, a 10-city composite index, and twenty individual metro area indices;
- He published his book, “Irrational Exuberance” in March 2000, which described the formation of market bubbles. He is widely given credit for predicting the Tech Crash in 2000, although many pundits claim that to be wrongfully so. Timing can be everything, as was the date of his book’s release;
- He revised his book in 2006 to include the bubble forming in the housing market, and, once again, his timing was impeccable. Did he predict the disaster in the housing industry and in financial markets to follow? Whether he did or not is up for conjecture, but it is often said that perception is more important than reality. His adoring throngs give him credit in both cases;
- The 3rd edition is now in print, which includes not only his previous thoughts on the tech and housing bubbles, but also on the high valuations that are occurring now in equity markets.
What do Shiller’s critics have to say about his forecasting prowess?
Success does attract followers, but also critics. Many critics complain that Shiller gets far too much credit for market realities that he never predicted in the short-term. They applaud him for his long-term analyses, but they become sanguine when they question whether his forecasts are both correct and timely. Other critics try to improve upon his CAPE chart or pick it apart as not being accurate enough. These analysts look to the last recession and point out that the earnings “trough” was so deep and lengthy that one must ignore its impact in the CAPE chart. If you use higher numbers, then the current figures do not look so bad.
Shiller has received this type of query many times over, but his response is more than plausible. When asked about the more recent distortion of earnings, he has noted in his research that in previous deep recessions, companies are more prone to making big write-offs to clean up their balance sheets when most people are looking for direct actions from management teams to improve future earnings. The recession “trough” may look deep, but if you acknowledge that the write-offs represented prior spending mistakes, then simple averaging should fix the issue. Per Shiller, “If I average over 10 years I don’t see that as a problem.”
What chart has Shiller seriously worried these days?
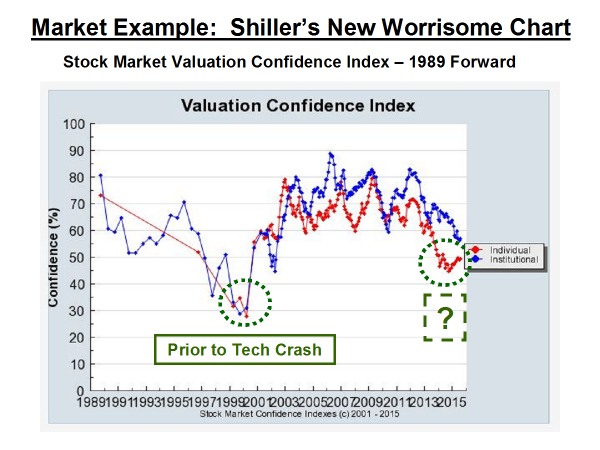
Bob Shiller, being the excellent economist that he is, does not rely on a single chart to give him valuable insights. He is constantly looking for repeating patterns, as would any trader in the forex market, to gain his edge on forecasting the future of market behavior and, more importantly, the evolution of “bubbles”, his specific forte, as perceived by analysts the world over. What chart is troubling Mr. Shiller today? He does not like what he sees in surveys taken of Investor confidence that measure valuation sentiments. Here is the chart that he presented in a recent interview with the “Financial Times”:

Shiller stated that this index reflects that Investor worries are at their greatest level since 2000. The recent 10% correction that occurred during one week in August produced global shockwaves. Per Shiller, “It looks to me a bit like a bubble again with essentially a tripling of stock prices since 2009 in just six years and at the same time people losing confidence in the valuation of the market… It suggests to me that many people are re-evaluating their exposure to the stock market. And we could see aftershocks of the correction.”
What else is bothering analysts out there? One analyst noted that, “At the end of August 2015 the 50-day moving average of the S&P 500 crossed its 200-day moving average to the downside – the 33rd occurrence of a “Death Cross” since 1950. During the last 65 years there were ten recessions. A Death Cross preceded six recessions and occurred early in four recessions.” According to this analysis, we have from one to eighteen months to prepare for the worst. Is the past really a good indicator of future upheavals?
Concluding Remarks
Whom are we left to believe? Even Shiller is not convinced about what to do going forward: “I’ve been very wary about advising people to pull out of the market even though my CAPE ratio is at one of the highest levels ever in history. Something funny is going on. History is always coming up with new puzzles.” Puzzle or not, what goes up must eventually come down, at least in forex markets. No one likes surprises, but to be forewarned is to be forearmed!
Risk Statement: Trading Foreign Exchange on margin carries a high level of risk and may not be suitable for all investors. The possibility exists that you could lose more than your initial deposit. The high degree of leverage can work against you as well as for you.