Review and Update
Over the last few weeks, I have been discussing the ongoing consolidation process for the S&P 500 from the March highs. (For a review read: “Oversold Bounce Or Return Of The Bull,” and “Return Of The Bull…For Now.”) As the expected rally in stocks, and reversal in bonds, took shape as the S&P 500 was finally able to ratchet a record close at 2399.29. (Read: 10/2016 – “2400 Or Bust”)
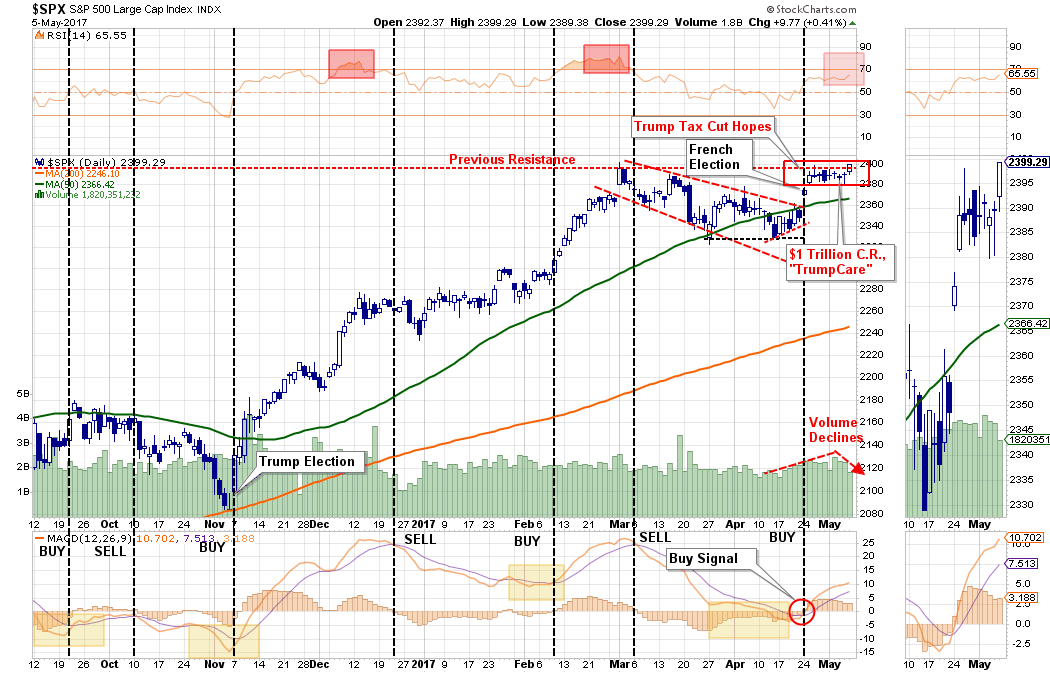
“With the market on a short-term ‘buy signal,’ deference should be given to the probability of a further market advance heading into May. With earnings season in full swing, there is a very likely probability that stocks can sustain their bullish bias for now.”
The market did do exactly that this past week, and while hitting a new high, as noted above, it was a “weak” breakout as volume contracted. My friend Dana Lyons made an interesting observation this past week:
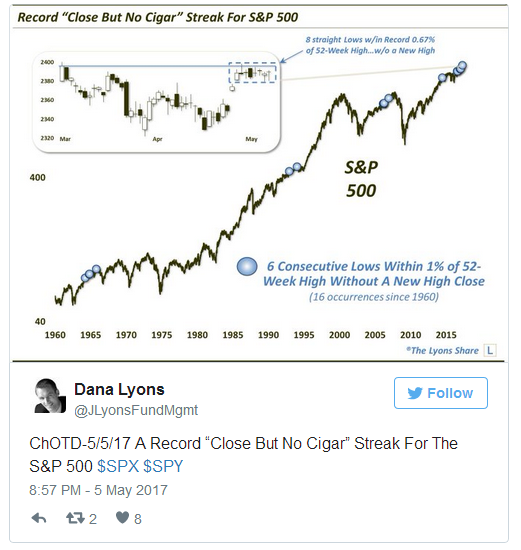
You will notice that while such events did NOT rule out “new highs” first, such periods often preceded either mild or intermediate-term corrections.
Furthermore, despite the record close on Friday, it did little to change the intermediate term backdrop of the markets. The “warning signal” I discussed three weeks ago, still remains which is currently keeping a lid on stock prices for now. More importantly, we remain very close to triggering the secondary “sell signal,” also from an extremely high level, which would also raise caution levels higher, cut such has not happened…yet.
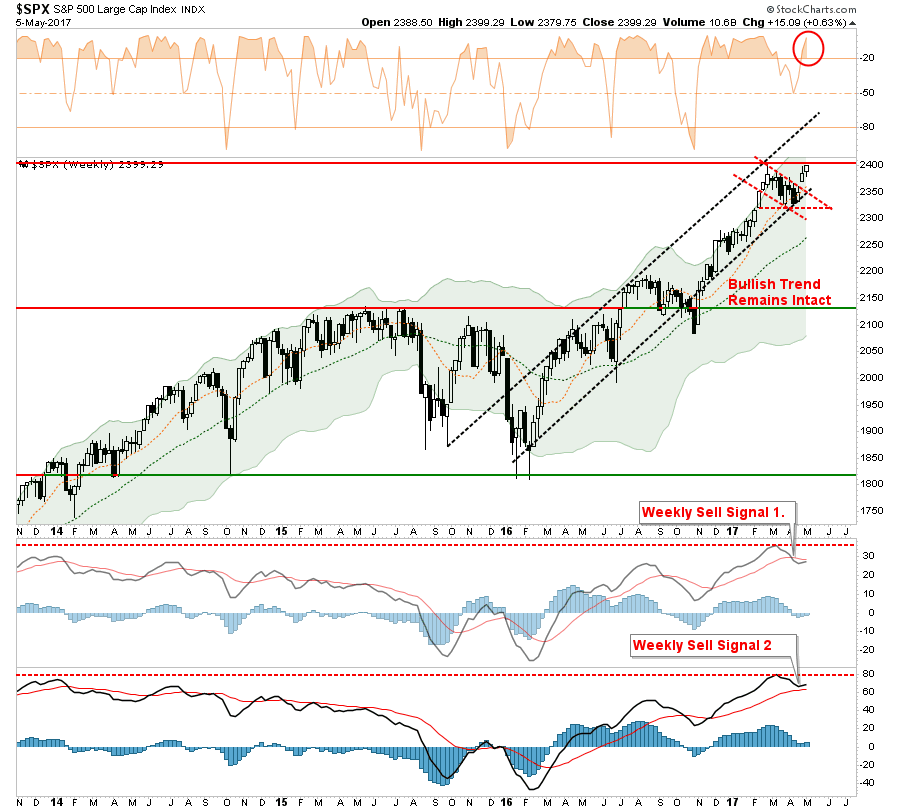
Importantly, both signals are improving over the last week, and, as I wrote last week:
“If the markets can continue to rally next week, and push to new highs, then both of those signals will reverse. The problem is the reversal from high levels historically has only been short-lived before a more significant decline took place as shown in the chart below.”
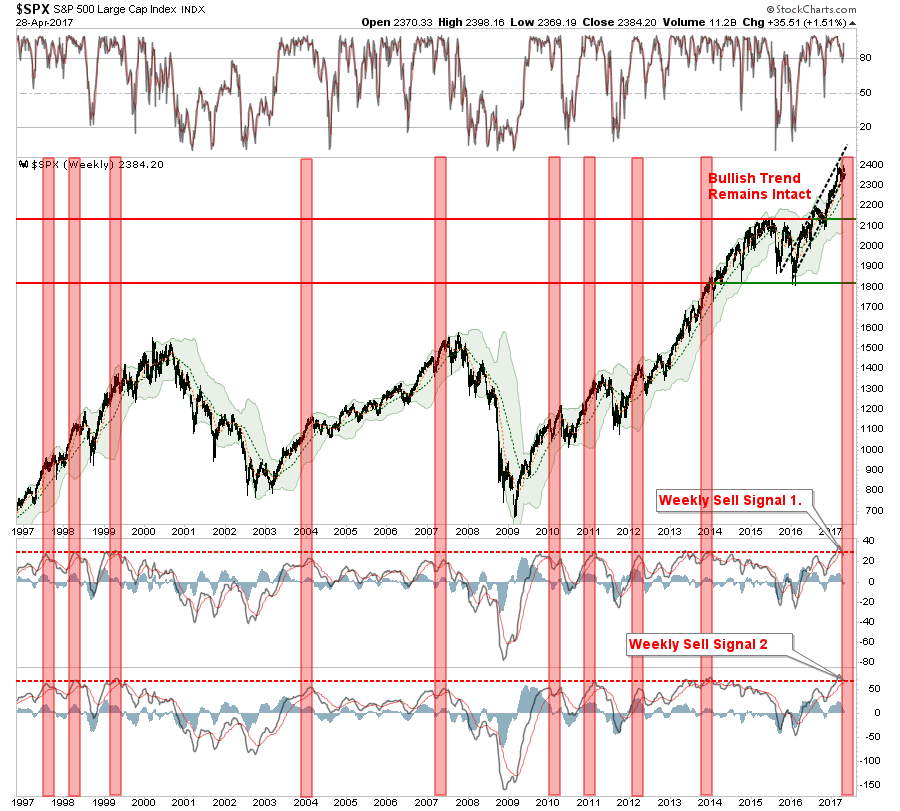
While much of the price action on Friday was due to continued “dovish Fed-speak” from a raft of speakers on Friday, it was also the high expectation of a successful French election this coming weekend. But, as Kevin Muir noted on Friday:
“Yet, since it was announced that Le Pen and Macron had advanced to the second round, the market has become convinced Macron will be the next leader of France. Yeah, I get it, the math definitely seems to indicate that Le Pen will not be able to defeat Macron.
The market is way too cavalier about this weekend’s election. In modern history, there has never been a French election without one of the two main parties being in the second round. This is unprecedented. If someone tells you they know how the French electorate will behave, they are deluding themselves.
There is no doubt Le Pen is at least as a polarizing figure as Trump. It will once again be difficult for many citizens to admit they plan on voting for her. Therefore the polls might be underestimating her support.”
Given that backdrop, any upset over the weekend could lead to a rather sharp reversal on Monday. So, remaining a bit cautious until after the election is likely wise. At current levels, the potential “reward” from an upward move next week is far outweighed by the downside risk.
Therefore, a “reactionary” approach to portfolio management is a better choice in the current environment. In other words, let the market determine our next course of action rather than trying to “guess” at what may happen. Throughout history, investors have rarely “guessed” well.
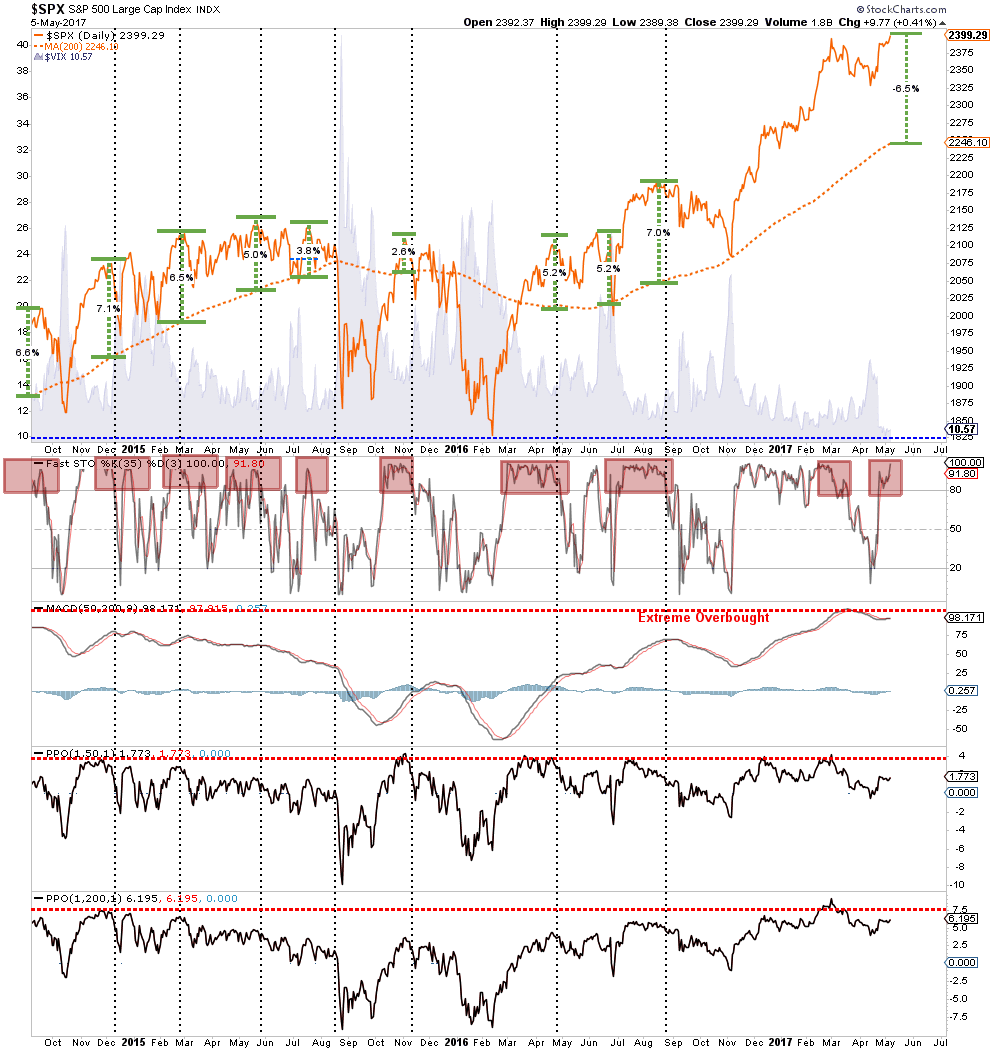
Despite the push higher this past week, it should be noted that since the beginning of March, internal measures have remained weak. With the markets very extended above their 200-dma, a correction is likely over the next month or so. This is particularly the case as volatility has dropped to its lowest levels in recent history.
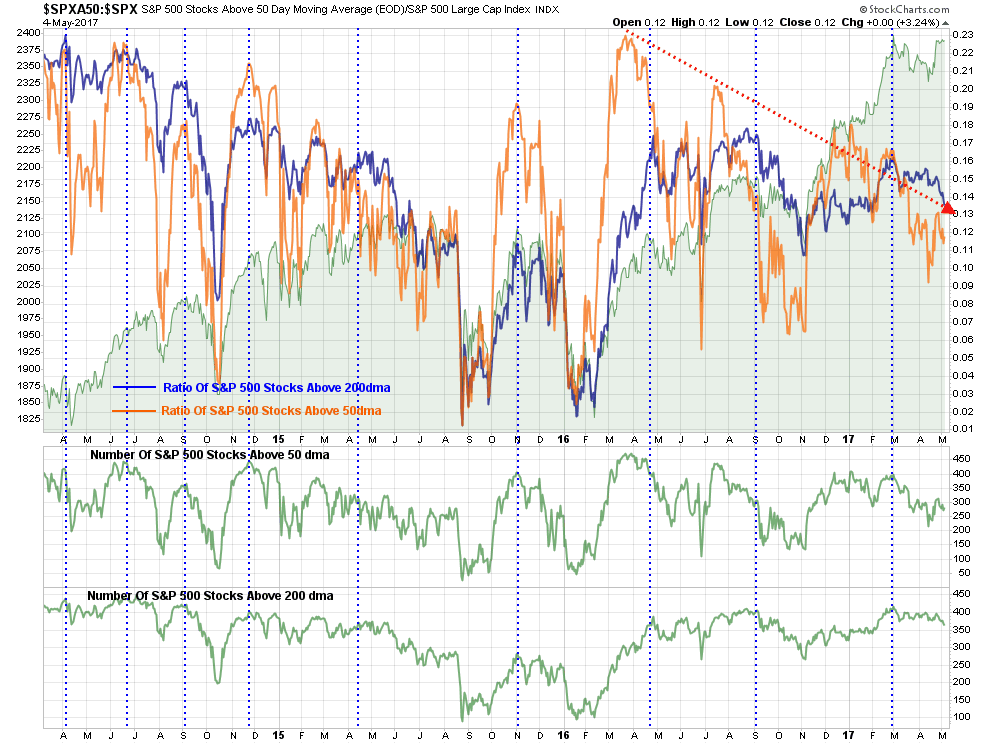
Furthermore, both the ratio and number of stocks above their respective 50 and 200 day moving averages has also remained weak.
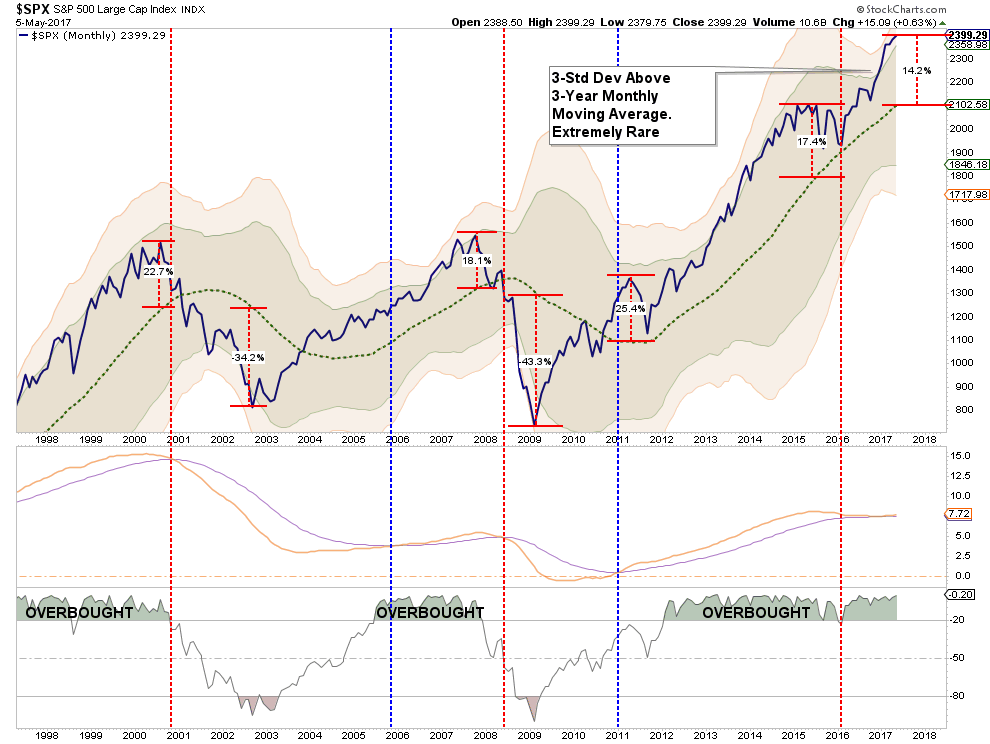
Lastly, the market remains very 3-standard deviations above its 3-year moving average. While the long-term signal currently remains on a “buy,” it will not require much weakness sometime this summer to trigger a long-term “sell.”
For now, the market remains in a bullish trend which keeps portfolios allocated on the long-side. Outside of small tweaks and close monitoring, nothing has occurred, yet, which would warrant more drastic movements within the allocation model. However, we have reached a point in the market cycle where the “risk” of remaining heavily invested in the market far outweighs the potential “reward.”
As has been the case over the last couple of weeks, caution, nothing more, is advised for now.
AHCA Solves Little
First, everyone just calm the **** down.
The passage of the American Health Care Act by Congress this past week does nothing immediately. Nobody is going to die. No one will lose access to health care. The world will not end.
All that happens now is the bill moves to the Senate where it will likely be dead on arrival. Given the bill only passed by 4-votes in the House, there is a much narrower spread of leadership in the Senate. The bill will likely get tied up in debates, and even it does somehow miraculously get passed out of the Senate, whatever changes are made will likely lead to a loss when it returns back to Congress for a final vote.
Then we will get to restart this whole process over again.
This also means that tax reform, repatriation, and infrastructure spending are likely much further down the road than currently estimated.
One thing, however, is for certain – Obama no longer owns “the failed healthcare plan.”
It now squarely rests on the shoulders of President Trump and the Republican party. Since the current construction will increase healthcare costs and government debt, the opposite of why Trump was elected, it will likely cost Republicans control of House and Senate in the next election.
The ACHA, or now known as “Trump Care,” is roughly 90% ObamaCare with the taxes stripped out of it. Here are the details as provided by Goldman Sachs) on Friday:
COVERAGE
- It would allow young adults to stay on their parents’ health plan until age 26.
- The bill would let states opt out of Obamacare’s mandate that insurers charge the same rates on sick and healthy people.
- It would also allow states to opt out of Obamacare’s requirement that insurers cover 10 essential health benefits, such as maternity care and prescription drug costs.
- The measure would provide states with $100 billion, largely to fund high-risk pools to provide insurance to the sickest patients.
- The bill also would provide $8 billion over five years to help those with pre-existing conditions pay for insurance.
- It would let insurers mark-up premiums by 30 percent for those who have a lapse in insurance coverage of about two months or more.
- The ability to charge older Americans up to five times more than young people. Under Obamacare, they could only charge up to three times more.
TAX
- The bill would end Obamacare’s income-based tax credits in 2018, which helps low-income people buy insurance.
- These would be replaced with age-based tax credits ranging from $2,000 to $4,000 per year that would be capped at upper-income levels.
- The Republican bill would abolish most Obamacare taxes, including on medical devices, health insurance premiums, indoor tanning salons, prescription medications and high-cost employer-provided insurance known as “Cadillac” plans.
- Those taxes paid for Obamacare. Republicans have not said how they would pay for the parts of the law they want to keep.
- The bill would also repeal the Obamacare financial penalty for the 2016 tax year for not purchasing insurance, as well as a surtax on investment income earned by upper-income Americans.
- It would repeal the mandate that larger employers must offer insurance to their employees.
MEDICAID
- The bill would allow the Medicaid expansion to continue until Jan. 1, 2020. After that date, expansion would end and Medicaid funding would be capped on a per-person basis.
- State Medicaid plans would no longer have to cover some Obamacare-mandated essential health benefits, fulfilling a Republican promise to return more control to the states
The ramifications for the economy are not good. For investors it likely means a much longer wait for tax reform and the expected boost to corporate profitability. Per Goldman:
“In our view, House passage of the AHCA is likely to further delay the consideration of tax reform. House passage arguably reduces doubts that Republicans can assemble a working majority for controversial legislation in the House, which suggests that complex tax legislation might be achievable as well. However, since the House cannot act on tax reform using the ‘reconciliation’ process until the Senate has passed (or decides not to pass) its own health legislation, tax legislation looks unlikely to emerge until September in our view. Given the time it will likely take to reach an agreement on tax legislation, this suggests that enactment of tax legislation is unlikely until Q1 2018. While our base case is still that legislation is more likely than not to pass in 2018, further delays could push consideration of tax legislation too close to the upcoming midterm election, reducing the likelihood that tax legislation is enacted in the next two years.”
For investors, it is a case of “Waiting On Godot.” The only question is just how long will they wait.
Debt Is The Problem
But of course, here is the bigger point.
The chart below is the current amount of debt (not including the $1.1 Trillion continuing resolution last week) and the amount of interest currently being paid on that debt.
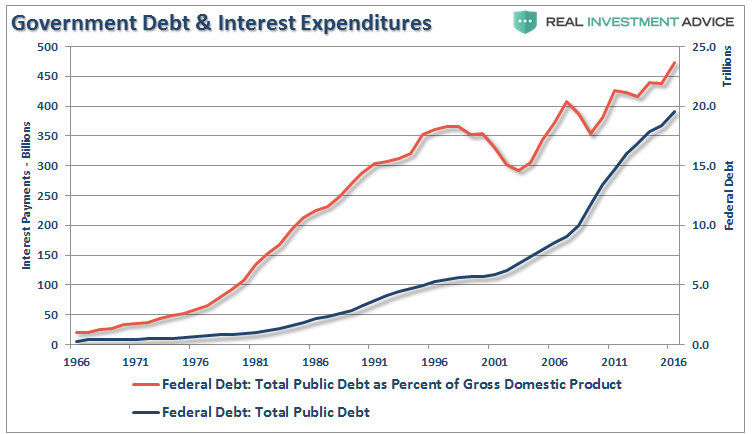
As the Committee For A Responsible Budget penned on Friday:
“Setting aside the health policy implications of these changes, the fiscal implications could be significant. If more people purchase health insurance, more will be eligible for the AHCA’s tax credits. Assuming no change in employer coverage, we estimate an increase of one million enrollees would cost about $30 billion over a decade, two million would cost $60 billion, five million would cost $150 billion, and ten million would cost $300 billion.”
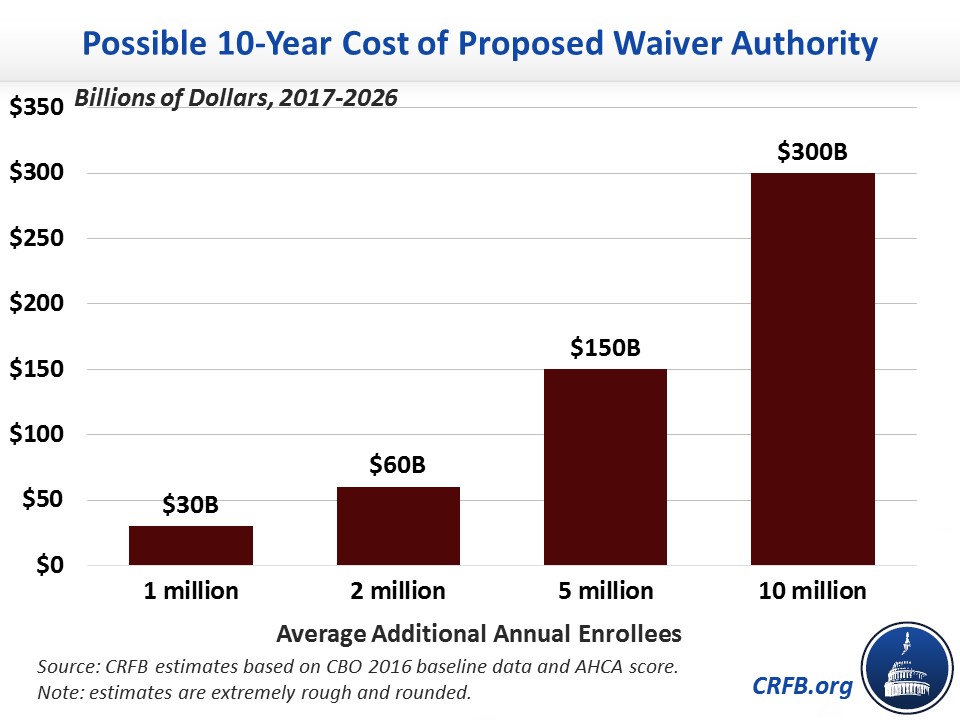
“Taken together, that means the amendments would save an additional $5 billion if one million more people enrolled in insurance each year than CBO’s prior projection. But it would cost $25 billion if two million more people enrolled, $115 billion if five million more enrolled, and $265 billion if ten million did. With 6.5 million or more additional enrollees, the entire legislation would likely increase rather than reduce deficits.”
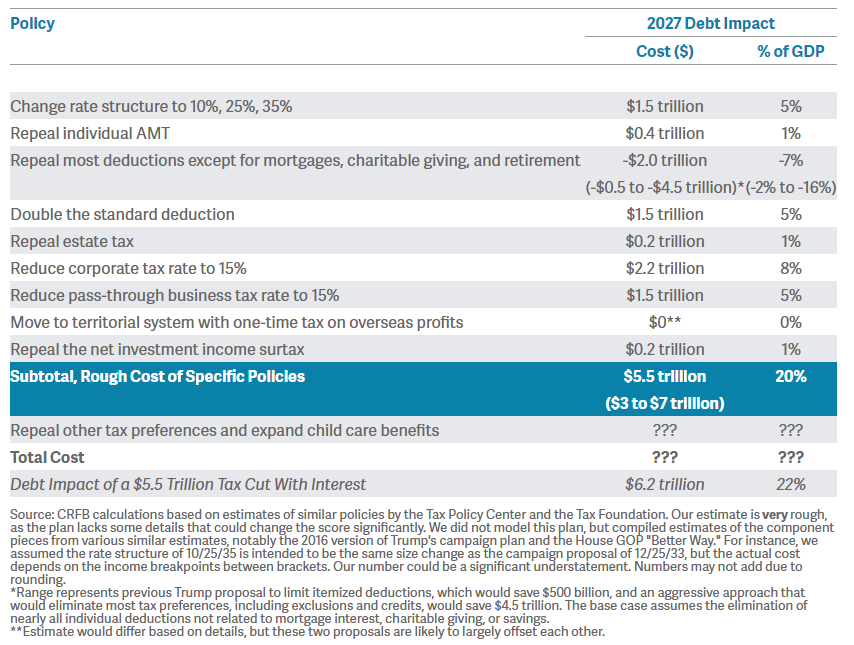
The significant importance of this was pointed out just recently in “Tax Cuts The Economic Growth Cure-All?”
“Of course, as noted, rising debt levels is the real impediment to longer-term increases in economic growth. When 75% of your current Federal Budget goes to entitlements and debt service, there is little left over for the expansion of the economic growth.”
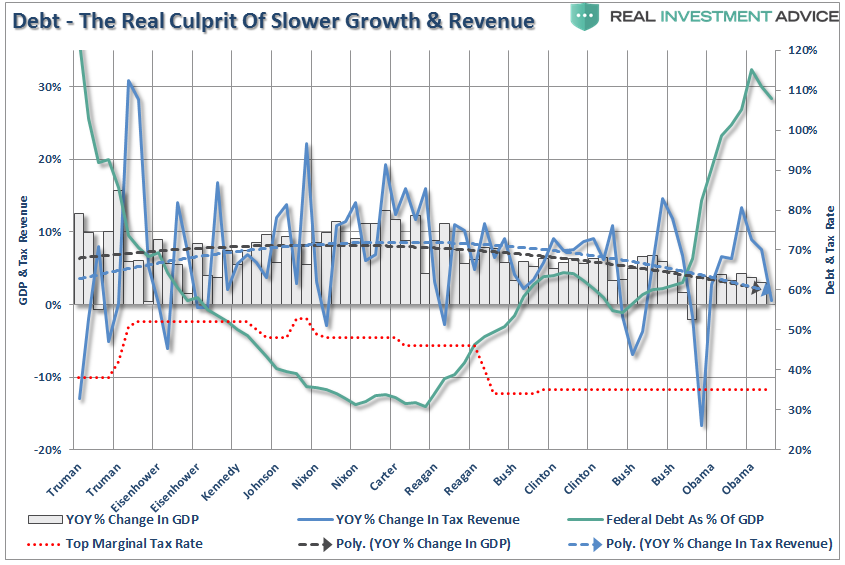
“The tailwinds enjoyed by Reagan are now headwinds for Trump.”
The true burden on taxpayers is government spending, because the debt requires future interest payments out of future taxes. As debt levels, and subsequently deficits, increase, economic growth is burdened by the diversion of revenue from productive investments into debt service.
This is the same problem that many households in America face today. Many families are struggling to meet the service requirements of the debt they have accumulated over the last couple of decades with the income that is available to them. They can only increase that income marginally by taking on second jobs. However, the biggest ability to service the debt at home is to reduce spending in other areas.
While lowering corporate tax rates will certainly help businesses potentially increase their bottom line earnings, there is a high probability that it will not “trickle down” to middle-class America.
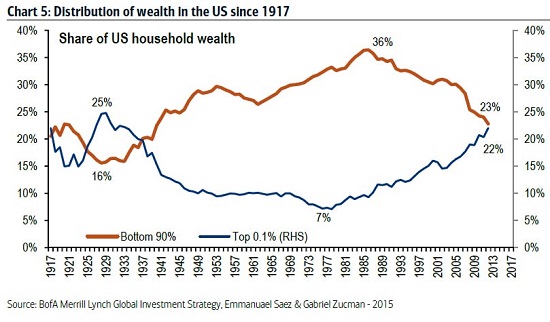
While I am certainly hopeful for meaningful changes in tax reform, deregulation and a move back towards a middle-right political agenda, from an investment standpoint there are many economic challenges that are not policy driven.
- Demographics
- Structural employment shifts
- Technological innovations
- Globalization
- Financialization
- Global debt
These challenges will continue to weigh on economic growth, wages and standards of living into the foreseeable future. As a result, incremental tax and policy changes will have a more muted effect on the economy as well.
See you next week.
Market and Sector Analysis
Data Analysis Of The Market and Sectors For Traders
S&P 500 Tear Sheet
The “Tear Sheet” below is a “reference sheet” provide some historical context to markets, sectors, etc. and looking for deviations from historical extremes.
If you have any suggestions or additions you would like to see, send me an email.
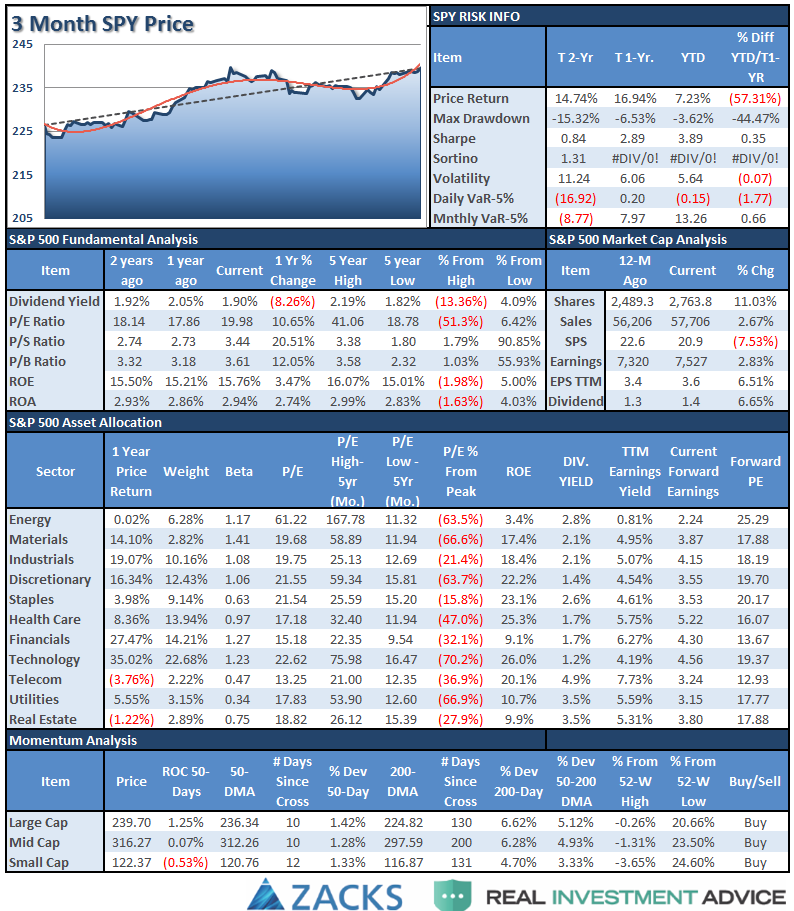
Sector Analysis
As I stated last week:
“With that being said, the overall backdrop remains BULLISH for now. I do remain somewhat cautious on allocations currently given, as discussed at the start of this missive, the “weekly sell signal” alert remains intact currently and at a high level.
However, let me reiterate, I remain long-biased in portfolios currently, but am also maintaining fairly tight stop-loss levels as well as hedges currently. Although we did lighten up on those hedges two weeks ago.”
Before I get into the sector/index overview, I want to address two important issues: Oil and Interest Rates
Oil
I have noted in the sector review two weeks ago:
“The OPEC oil cut has likely run the majority of its course and with Permian Basin production on the rise, the pressure on oil prices from supply/demand imbalances remains an issue.
However, the recent test of $48/bbl support provides a support level currently, but a break of that level will likely see oil sliding back to the low 40’s. While energy-related earnings have helped the overall S&P 500 earnings rebound over the last quarter, it is likely transient and forward earnings estimates will likely have to be ratcheted down rather sharply for the rest of the year.
Currently, the energy sector remains in a negative trend and suggests a further decline in oil prices will likely lead the sector substantially lower. Importantly, while the sector is oversold enough for a bounce in the short-term, it is not unprecedented for the sector to remain oversold during a continued decline as the highlighted green area shows.”
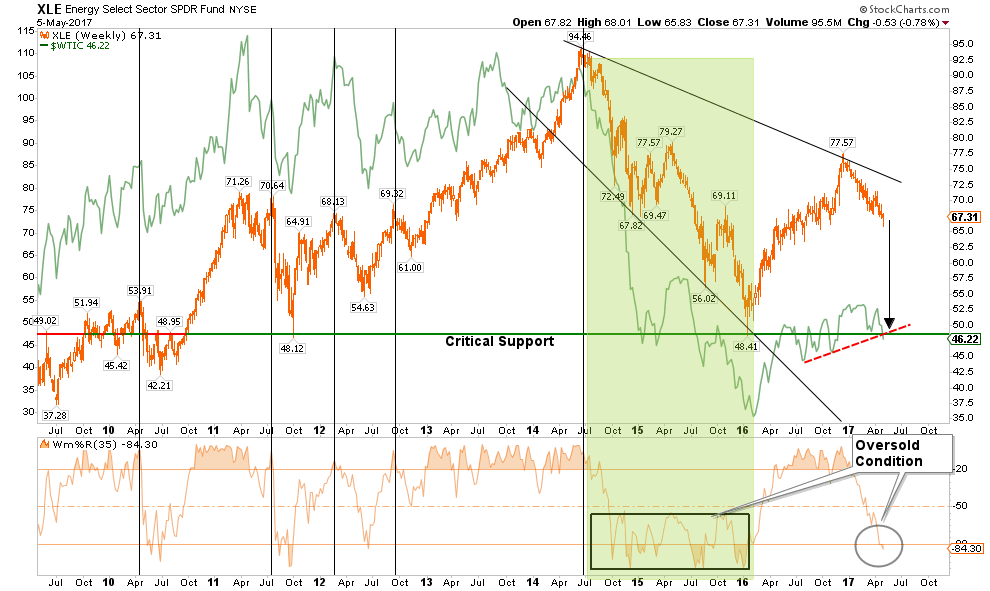
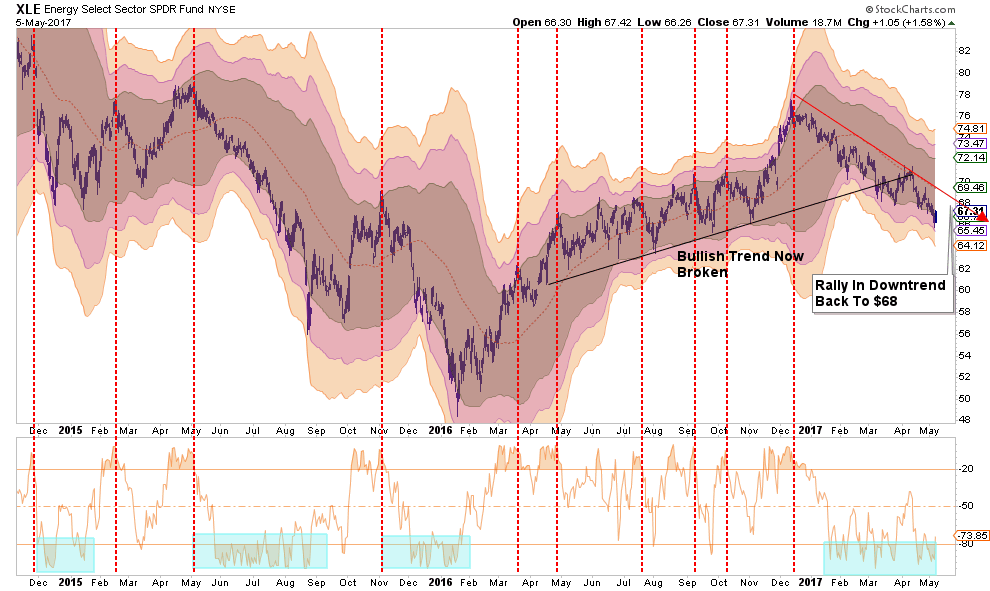
With oil now below support, $48/bbl becomes more formidable resistance. A failure to climb back above resistance this coming week will likely continue to press oil prices lower. However, on a short-term basis, energy stocks, as represented by the Energy Select Sector SPDR (NYSE:XLE), pushed into 3-standard deviations below the moving average last week. It is likely the reflexive rally could push the sector back towards $68 where positions can be reduced for now as the bullish trendline from 2016 has been broken.
Interest Rates
Several weeks ago I noted that we had lifted some of our interest rate sensitive portfolio hedges as interest rates hit our target of 2.2%. At that time we suggested rates could reverse back to 2.3-2.4%.
As of this past week, rates pushed toward 2.4% as expected and the iShares 20+ Year Treasury Bond (NASDAQ:TLT), our preferred proxy for buying and selling individual bonds, moved closer to our “buy level” of $120.
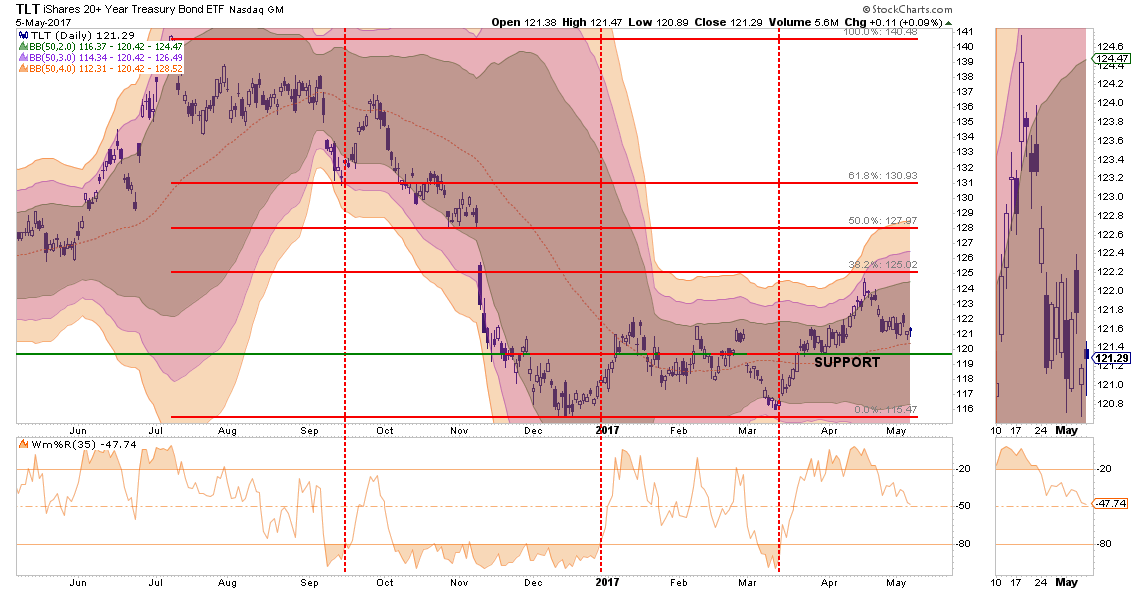
With bonds currently in between overbought and sold, no new positions are recommended currently and we are still maintaining our expectations of rates reaching the 2.4% range over the next month.
Let me be clear, I ultimately expect rates on the 10-year Treasury to reach 1.5%, or less, within the next 24-months which is why I continue to aggressively buy fixed income on opportunity. Over the next decade, based on current equity valuations, bonds will outperform stocks on a total return basis.
Okay, let’s get to the sector analysis.
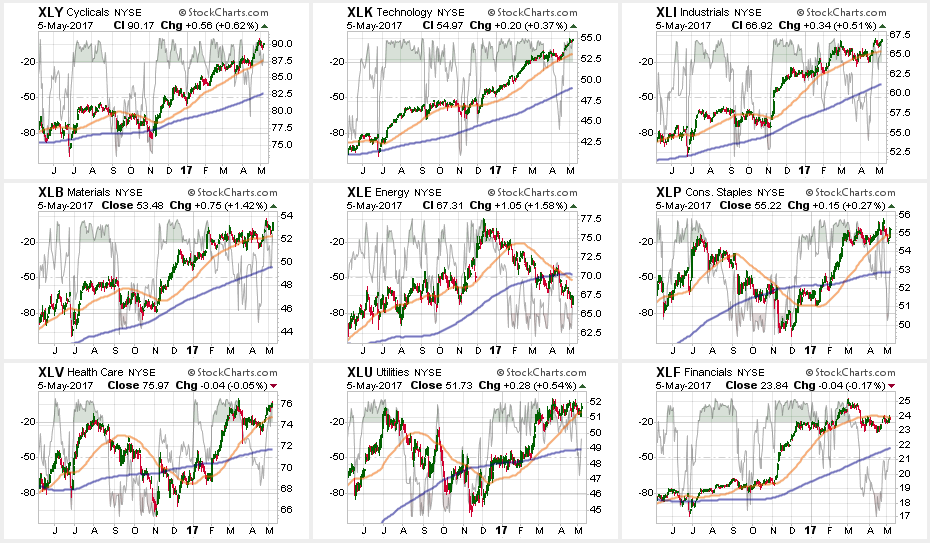
Discretionary, Technology, Industrials, and Materials sectors continued their bullish trend but did exhibit some relative weakness after last week’s strong advance. Maintain model portfolio weights for now as the bullish trend remains positive, but raise stop levels.
Energy continues to struggle after breaking its 50-dma and 200-dma. While energy had a bit of a bounce on Friday, the trend remains sorely negative. Energy has also triggered a major sector sell signal with the cross of the 50-dma below the 200-dma. Remain heavily underweight energy for the time being.
Financials recently broke its 50-dma and a failed rally last week at that level of resistance keeps investors underweight the sector for now.
Healthcare, Utilities, and Staples continue to maintain strength but did weaken a bit as of late. As stated, we did trim back on some of these hedges against the “Trump Trade,” but they are still performing well currently so we are maintaining positions for now.
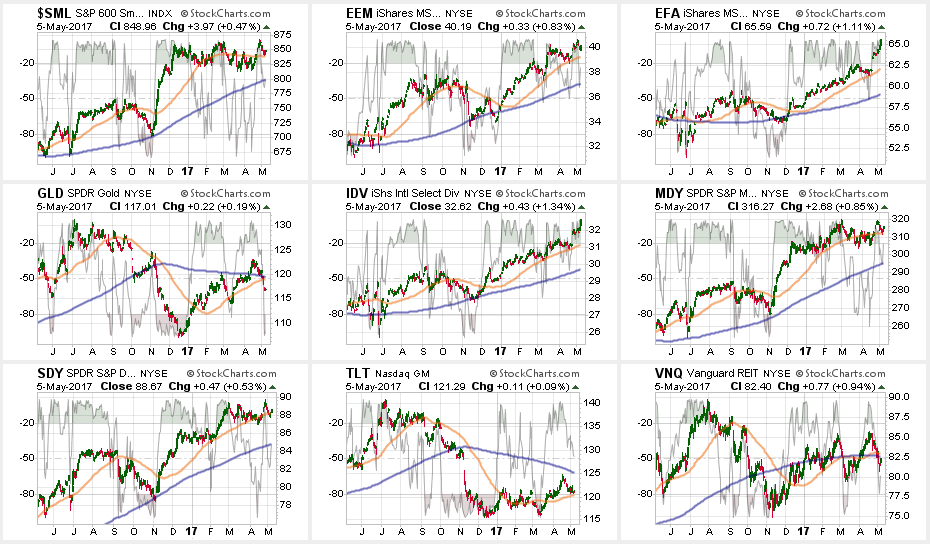
Small and Mid-Cap stocks lost steam last week with both flirting with the 50-dma’s after getting very overbought last week. As I noted last week:
“The question of sustainability of that strength will be answered this coming week. Continue to hold current positions (after recommending to take some profits recently) for now. A break of the multiple-bottom lows is now the ‘full stop.'”
The failure to maintain its strength from last week, puts support levels into close focus. Stops should be maintained as instructed last week.
Emerging Markets, International, and Dividend Yielding Stocks (IDV, SDY) reversed recent weakness following the French election as shorts were forced to cover, however, Emerging Markets struggled a bit last week while developed countries continued to surge based on a Macron win in France. There is a good bit of risk built into international stocks currently, but after having already taken profits a few weeks ago, we continue to hold these sectors for now with stop levels moved up to the recent lows.
Bonds and REITs – a few weeks ago I recommended taking profits from these hedges as they had become extremely overbought. I stated then:
“If the broader markets can rally over the next week or two, simply due to a reflexive oversold condition, look for these sectors to pull back to provide a better entry point.”
This has been the case. Now we wait to see what happens next. See analysis above.
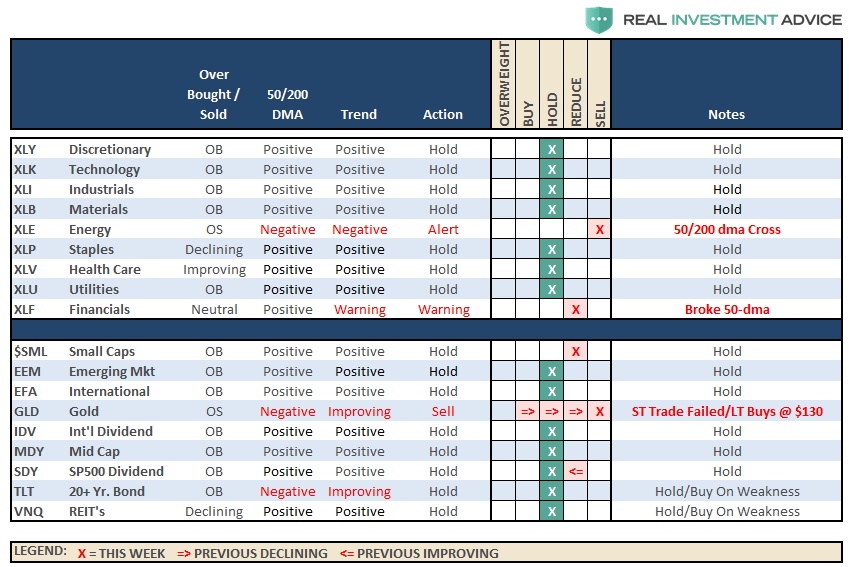
The table below shows thoughts on specific actions related to the current market environment.
(These are not recommendations or solicitations to take any action. This is for informational purposes only related to market extremes and contrarian positioning within portfolios. Use at your own risk and peril.)
Portfolio Update:
While the bullish trend remains positive, which keeps us allocated on the long side of the market, the weekly “sell signal” alert is not being dismissed.
However, the rally last week, and the breakout to new highs did shore up some of the short-term weakness in the market, and as noted last week:
“We are looking for a pullback to either support, or a breakout to new highs, for an opportunity to put some of the recently harvested cash back to work on the long side.”
We will watch this breakout this coming week to see if it can hold and evaluate sustainability as we head into the seasonally weak summer period. If it holds, and shows some improvement, we will start allocating some of our reserves into our core holdings. We are also moving all stops up to current support levels.
