We live in “interesting times.” If you follow the financial news at all it is possible to come away thinking that financial armageddon is just around the corner (and given the current economic turmoil occurring around the globe and the $19 trillion dollar gorilla in the room here at home, it just might be).
But investors who plan to hang in there just a little longer before putting it all in gold (or the mattress) still have to figure out where to put their money (assuming of course that they have any to put somewhere).
A Two Fund Portfolio for February/March/April
Retailing stocks and energy stocks have both demonstrated a tendency to perform well during the late winter and early spring months of February, March and April. So here is a “thought for consideration”.
*50% in retailing stocks
*50% in energy services stocks
Given the iffy nature of consumer spending and the outright horrific goings on in the energy sector, it’s pretty easy to simply say, “Eh, yeah maybe wait until next year.” And that may just be the thing to do. But for argument’s sake let’s look at how this “portfolio” would have performed since 1989.
Rules:
*At the close on the last trading day of January each year, 50% goes into Fidelity Select Retailing (FSRPX) and 50% goes into Fidelity Select Energy Services (FSESX).
*Both funds are sold at the close of the last trading day of April.
*No interest is assumed while out of the market.
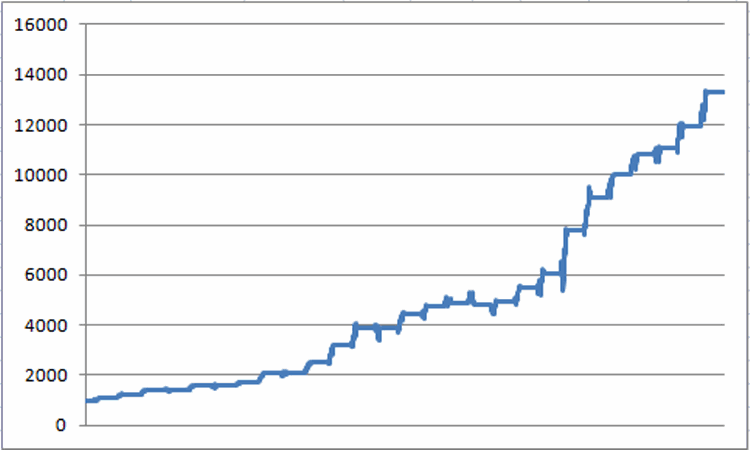
Figure 1 displays the growth of $1,000 using this strategy starting in 1989.

Figure 1 – Growth of $1,000 holding 50% FSRPX and 50% FSESX only during Feb/Mar/Apr each year since 1989
Figure 2 displays the year-by-year results.

Figure 2 – Year-by-Year Results
First the OK to Pretty Good News:
The average gain during this 3-month period for our two fund portfolio was +10.3% and the median gain was +10.1%. On the one hand, if you could earn 10+% every three months I assume you’d be pretty happy with that. At the same time though, an average gain of +10.3% doesn’t quite qualify as “rip-roaring”. And then there were the 8 years when the gain was less than +3%. So “pretty good”, but maybe not “wildy fantastic.” On the other hand…
…Now the Very Good News:
During the 27 years starting in 1989, our two fund portfolio has showed a gain during this 3-month period 100% of the time. That’s 27-and-oh!
A few results of note for this two-fund Feb/Mar/Apr portfolio:
*# of Gains = 27% (100%)
*Average gain = +10.3%
*Median gain = +10.1%
*Maximum gain = +28.3% (2009)
# of Losses = 0 times (0%)
The Wrong Way to Interpret the Very Good News:
Now if I were a crack marketing guy I would use phrases like “low risk” and “uncanny accuracy” and words like “you” and “can’t” and “lose”. But not only I am not a good marketing guy I am a guy who has come face-to-face with Murphy and his dreaded “Law” – and come out on the short end – more times than I care to recall. So do not make the mistake of thinking of this method as “low risk” or even “high probability”. 2016 is a brand new roll of the dice.
Summary
The results shown here suggest that a 50/50 retailing/energy services portfolio bought and held for three months might be a pretty good idea. The “news” of the day seems to suggest otherwise. So what to do?
That’s up to each investor to figure out for his or her self.
