In the last couple of weeks every time we posted an analysis on US indices, we mentioned the same characteristics that the markets continue to show over the last couple of months and with no clear direction. US markets are showing signs of divergence between the indices. While Dow Jones and S&P 500 managed to make new all time highs, Nasdaq and Russell 2000 are much weaker and are not only lagging behind, but also placing their longer-term bullish trend in danger. On a daily basis, as shown in the charts below, both NASDAQ Composite and Russel 2000 have broken important support levels and as shown by the Ichimoku cloud, trend has most probably reversed. Both indices have their prices below the Ichimoku cloud or fighting inside it in order to regain bullish momentum. Both indices look weak.
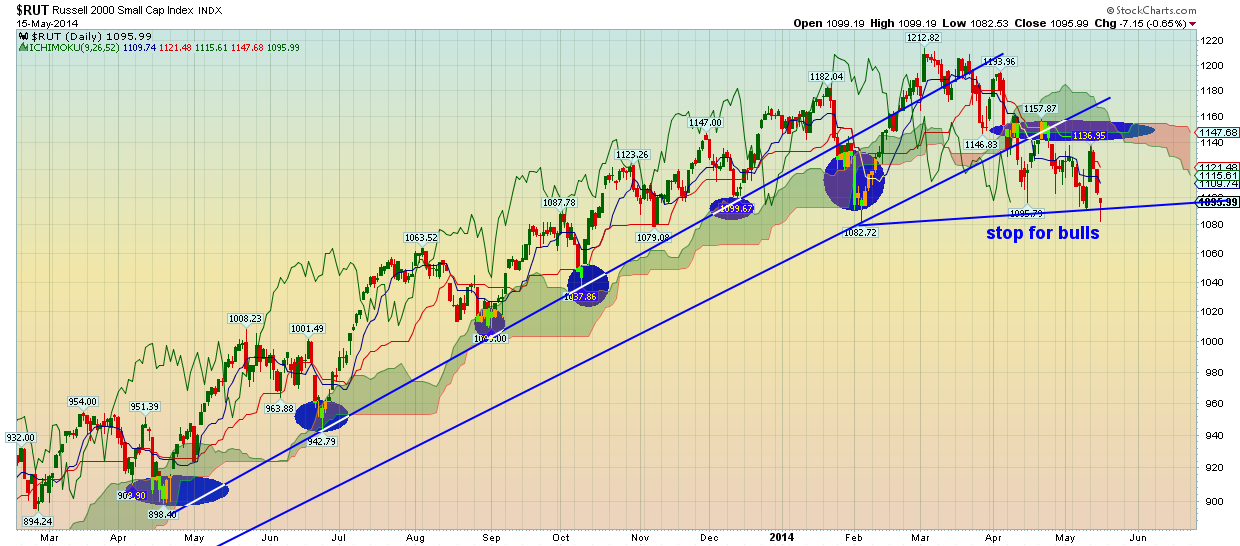
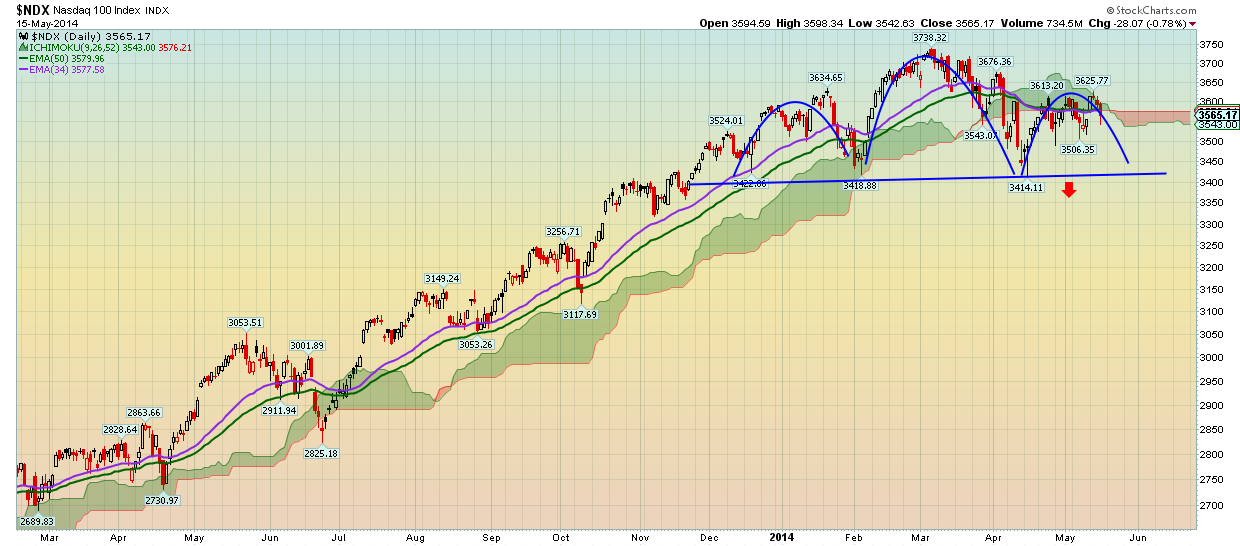
Both Indices are making lower lows and lower highs from their tops they made in March. So with S&P and Dow Jones near their all time highs, which index is going to follow the other? Will S&P and DJIA make a deep correction or will RUT and NDX outperform in the coming weeks in order to catch up with S&P and DJIA?
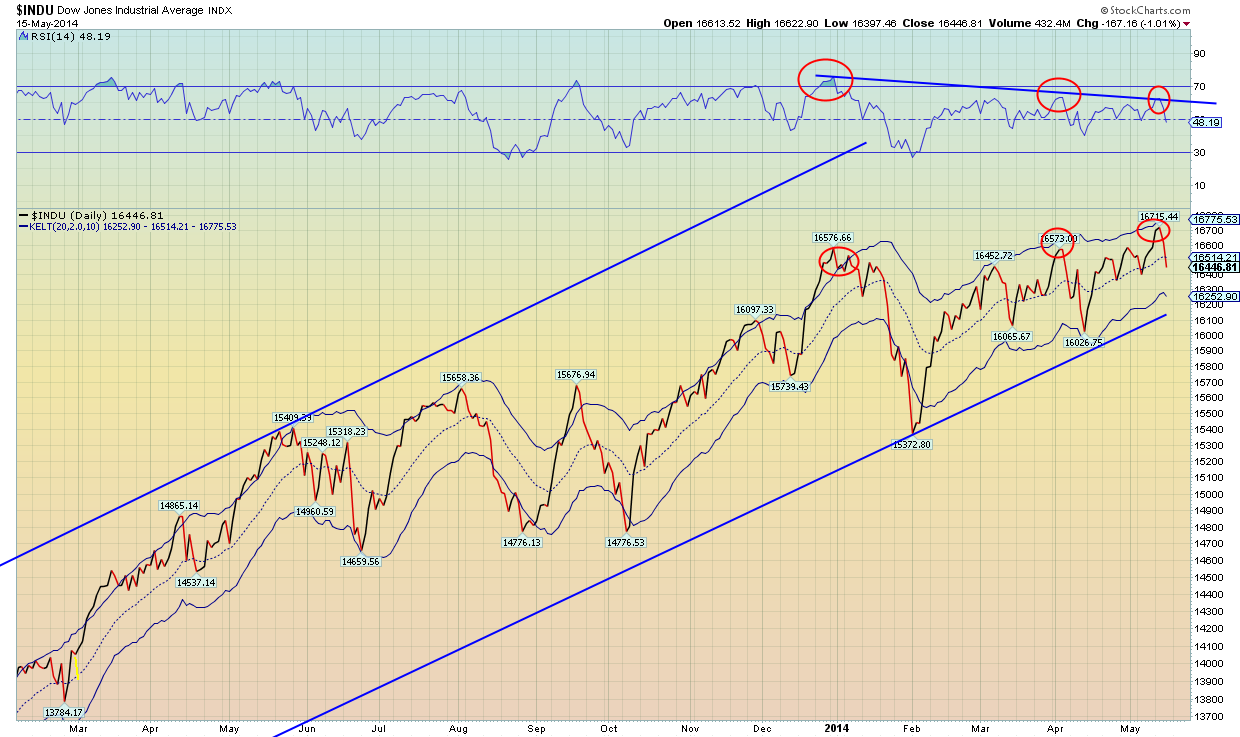
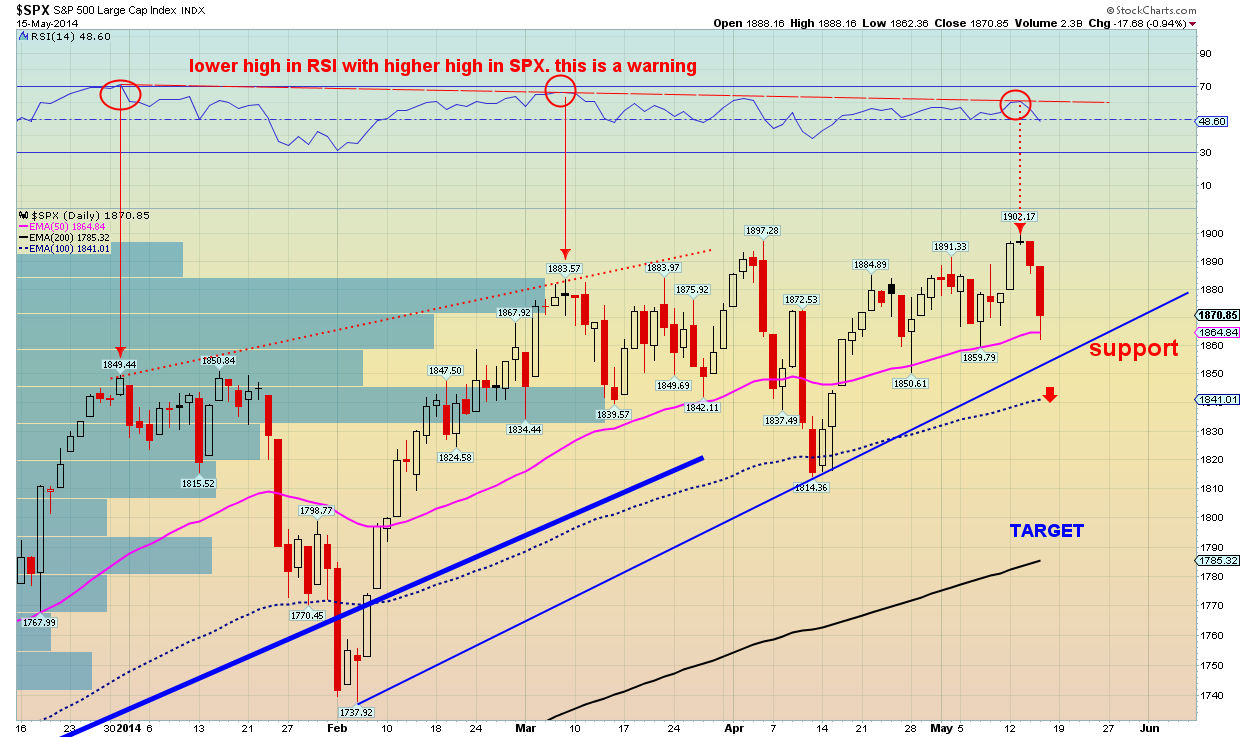
As we also mentioned in previous posts, both DJIA and SPX show divergencies in the RSI. This is just a warning that bulls should be cautious and raise their stops. This also shows how fragile the upward trend is. The divergencies can continue to run for more than a month, but we cannot ignore the warning signal they give. This does not mean that we should close all long positions and go short. On the contrary it means that we should raise our stops and remain long. Bulls need to be cautious and protect their positions. Long-term trend remains bullish.
An important factor to get a clearer picture of whether markets are in a risk-on mode or risk-off mode is to look at the FX markets. USD/JPY is an indicator I use to decide whether markets are expected to rally or pull back. In recent weeks, whenever the rally in equities is not followed by a rally in USD/JPY I get the feeling that the rise in prices is fragile and will pull back despite making new all time highs. USD/JPY also shows that we are in a crtical jucture. USDJPY is trading above an important long-term support and if this support is broken, I would also expect of equity markets to start a downward corrective move that could bring the S&P for example back toward 1750.
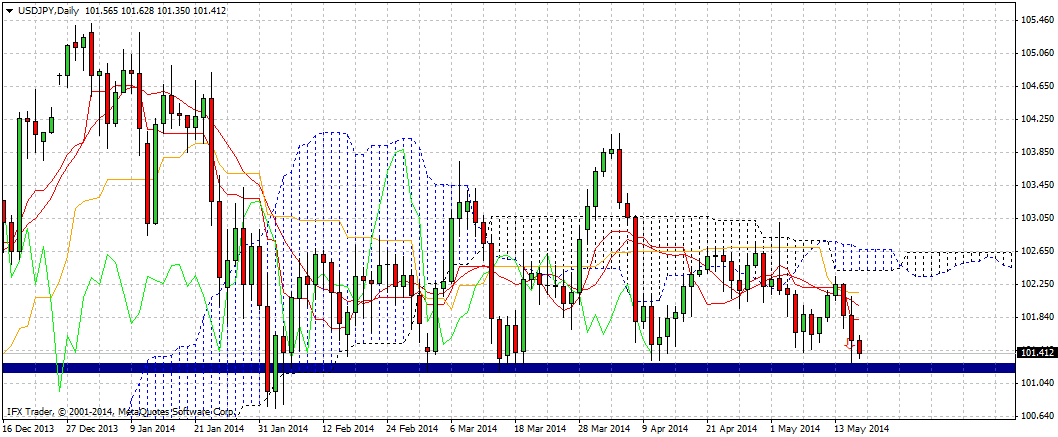
Concluding, I believe the markets are soon going to end the sideways movement they are in during the last two months. RUT and NDX have broken this range and I expect SPX and DJIA to follow. I give more chances of a downward corrective move and SPX and DJIA to try and catch up with NDX and RUT. This is also affected by the bearish view I have on USDJPY. If USDJPY breaks below 101, I believe this downward move will have started and we should expect to see DJIA and SPX break support levels.
Disclosure: None of the information or opinions expressed in this blog constitutes a solicitation for the purchase or sale of any security or other instrument. Nothing in this article constitutes investment advice and any recommendations that may be contained herein have not been based upon a consideration of the investment objectives, financial situation or particular needs of any specific recipient. Any purchase or sale activity in any securities or other instrument should be based upon your own analysis and conclusions.
