
There has been a lot of chatter regarding interest rates of late, so I decided that I would take some time and look at the technicals along with the supply and demand patterns. Interest rates have moved considerably higher in the last few months which has many believing this environment is here to stay. Taking a look at the two charts below, we are following the CBOE 10 Year Treasury Note Yield Index, which tracks the yield on 10-year treasury bonds, otherwise known as, 'the benchmark of interest rates'.
The first chart below is a monthly chart going all the way back to 1998. On the chart I have highlighted the two significant bear markets inside the boxes. I have also highlighted the three significant bull markets by marking the low to highs with green horizontal lines, as well as annotations.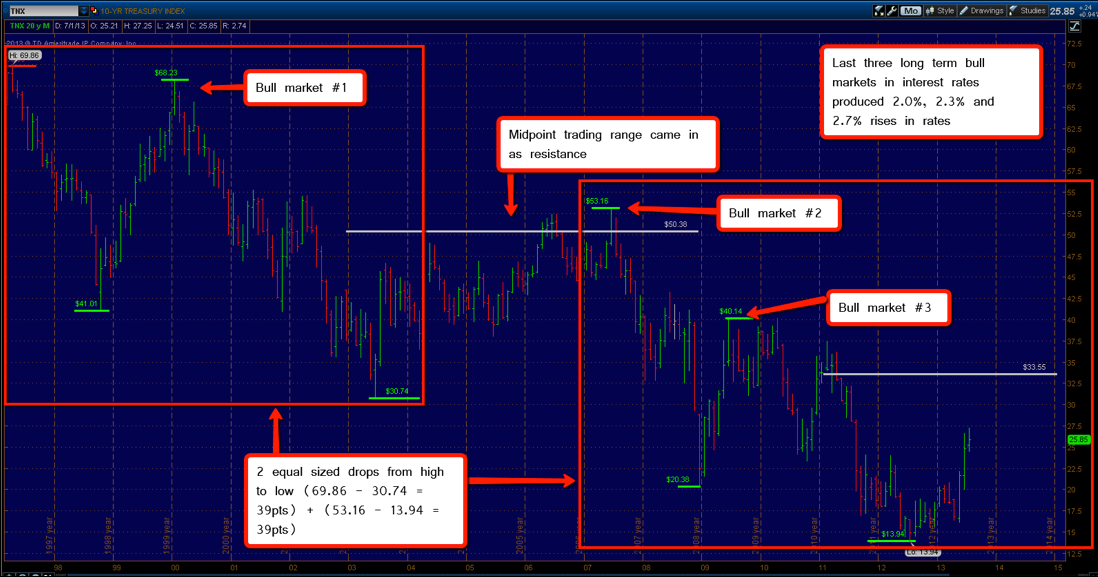
So let's walk through some of the characteristics of this price action starting from left to right. We have a bear market correction of 39 points (or 3.90%) from high to low. A bull market proceeds to push rates back up into the midpoint (gray horizontal line) of the prior trading range. The following bear market in rates proceeds to decrease interest rates another 3.90% (39 points), matching the previous. So now the technical signs seem to point to interest rates rising to at least retest the midpoint of this most current trading range at 3.55% (grey horizontal line-bottom right), just like it did from 2003-2007.
One thing we should also take away from this is the fact that rates did indeed rise almost the entire time of the 2002-2007 bull market in equities. I think there is a consensus building out there that rising rates would be crippling for the stock market. And maybe a parabolic move in interest rates would indeed be damaging. But a gradual rise in rates due to increased anticipation of real economic growth, in my opinion, should not scare you.
The second chart is a weekly chart of interest rates showing short-term support and resistance. Downside support should come in around the 2.30% range and if we can break above the 2.75% - 2.85% I would expect that retest of the trading range midpoint at 3.35% which would also match the size of the last bull market in interest rates. The last three bull markets in rates over the past 15 years have produced moves of 2.0%, 2.2% and 2.7% higher. I don't think we should expect anything less from this one as well.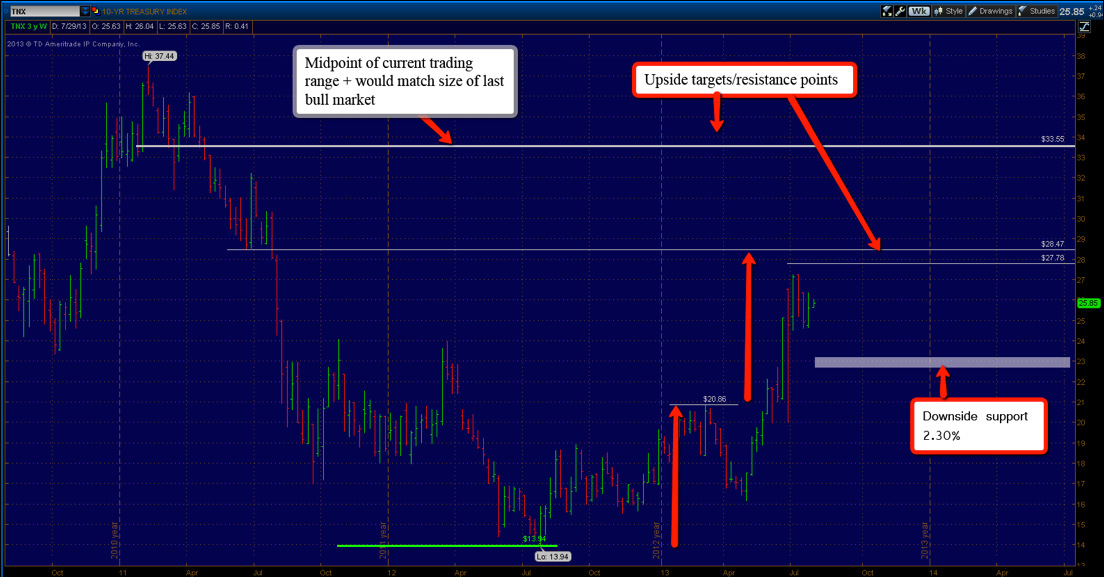
This next chart shows the weekly price action in TLT, or long-term US treasury etf, going all the way back to 2009. Bond prices and interest rates move inversely, as rates rise the prices of bonds drop and vice versa. The bonds with the highest durations or longest date to maturity usually get hit the hardest when rates rise. Bonds become cheaper because for example if rates were to move to 4.0%, all of a sudden your bonds paying 2.0% doesn't look so good. And less demand decreases value or price.
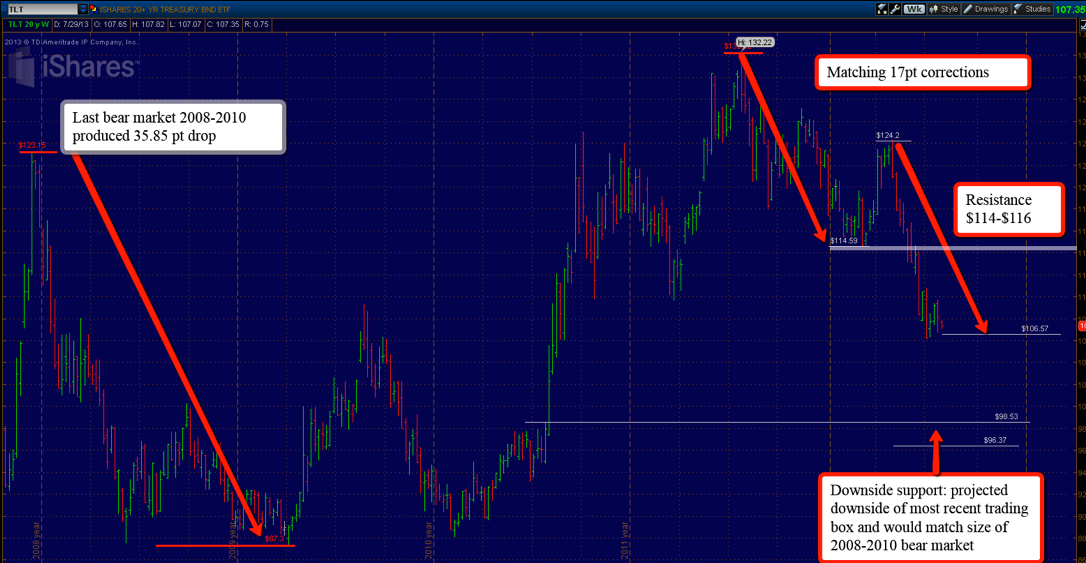
So the chart above shows the bear market that long term treasuries endured during the end of 2008 until 2010. I've annotated our current setup in TLT, which has now produced matching 17pt corrections from high to low. It has so far found support at the $106.50 level, resistance now stands at $114 - $116. I believe eventually TLT will find itself testing the downside support levels marked on the above chart which would match the size of the last significant bear market and also retest the breakout point in 2011. This area should become strong support for a move higher. I am not sure if we will ever see new highs again, but I think it would be a good spot to step in if you are looking for some bond exposure.
Let's conclude by taking a look at the performance of the different bonds year to date. The final chart actually shows that the high yield corporate, junk bonds and short treasuries are positive on the year while US long bond, TIPS and investment grade corporate are showing losses for the year.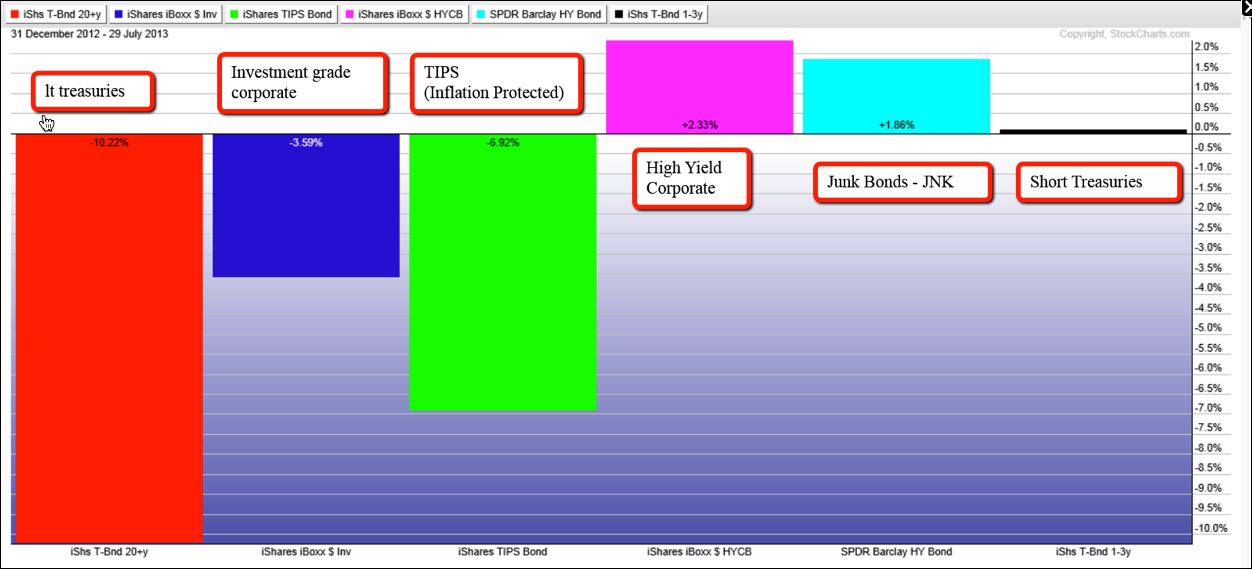
- English (UK)
- English (India)
- English (Canada)
- English (Australia)
- English (South Africa)
- English (Philippines)
- English (Nigeria)
- Deutsch
- Español (España)
- Español (México)
- Français
- Italiano
- Nederlands
- Português (Portugal)
- Polski
- Português (Brasil)
- Русский
- Türkçe
- العربية
- Ελληνικά
- Svenska
- Suomi
- עברית
- 日本語
- 한국어
- 简体中文
- 繁體中文
- Bahasa Indonesia
- Bahasa Melayu
- ไทย
- Tiếng Việt
- हिंदी
A Technical Look At Bonds
Published 07/30/2013, 11:12 AM
Updated 07/09/2023, 06:31 AM
A Technical Look At Bonds
3rd party Ad. Not an offer or recommendation by Investing.com. See disclosure here or
remove ads
.
Latest comments
Install Our App
Risk Disclosure: Trading in financial instruments and/or cryptocurrencies involves high risks including the risk of losing some, or all, of your investment amount, and may not be suitable for all investors. Prices of cryptocurrencies are extremely volatile and may be affected by external factors such as financial, regulatory or political events. Trading on margin increases the financial risks.
Before deciding to trade in financial instrument or cryptocurrencies you should be fully informed of the risks and costs associated with trading the financial markets, carefully consider your investment objectives, level of experience, and risk appetite, and seek professional advice where needed.
Fusion Media would like to remind you that the data contained in this website is not necessarily real-time nor accurate. The data and prices on the website are not necessarily provided by any market or exchange, but may be provided by market makers, and so prices may not be accurate and may differ from the actual price at any given market, meaning prices are indicative and not appropriate for trading purposes. Fusion Media and any provider of the data contained in this website will not accept liability for any loss or damage as a result of your trading, or your reliance on the information contained within this website.
It is prohibited to use, store, reproduce, display, modify, transmit or distribute the data contained in this website without the explicit prior written permission of Fusion Media and/or the data provider. All intellectual property rights are reserved by the providers and/or the exchange providing the data contained in this website.
Fusion Media may be compensated by the advertisers that appear on the website, based on your interaction with the advertisements or advertisers.
© 2007-2024 - Fusion Media Limited. All Rights Reserved.