For the Western gold community, the main theme for 2016 continues to be, “let the good times roll!”
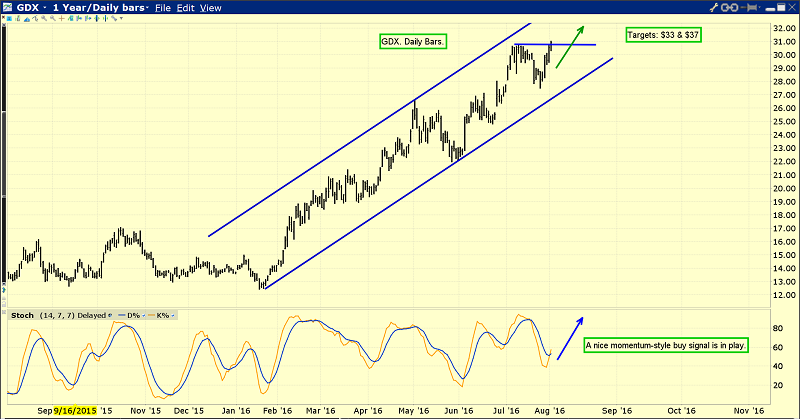
VanEck Vectors Gold Miners (NYSE:GDX) just raced to yet another new high for the year, and my next target prices are $33 and $37.
Technically, the situation is superb; there’s a momentum-style buy signal in play on my 14,7,7 Stochastics series, and the price chart is a textbook “staircase” pattern of higher highs and higher lows.
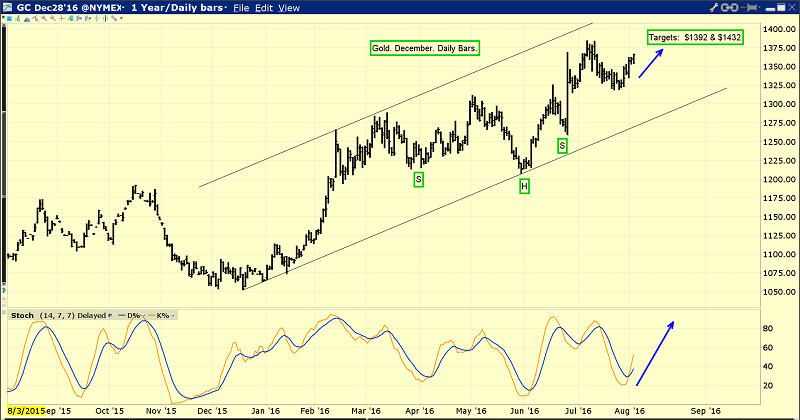
This is the wonderful daily gold chart. This Friday’s jobs report could be the catalyst that pushes gold towards $1392, and on to my $1432 target. Here’s why:
The US government could face a sovereign bond crisis if Janet Yellen hikes rates in a material way, but wage pressures and entitlements spending are growing while corporate earnings growth is stagnant.
That’s a deadly recipe for a “stagflationary firestorm.”
Each strong jobs report that is met with no interest rate hike from Janet convinces more institutional money managers that inflation is on the horizon, and so they buy undervalued gold stocks relentlessly.
I’ve argued emphatically that the Western world is moving from system risk to stagflation risk, and I’m in very good company with that view.
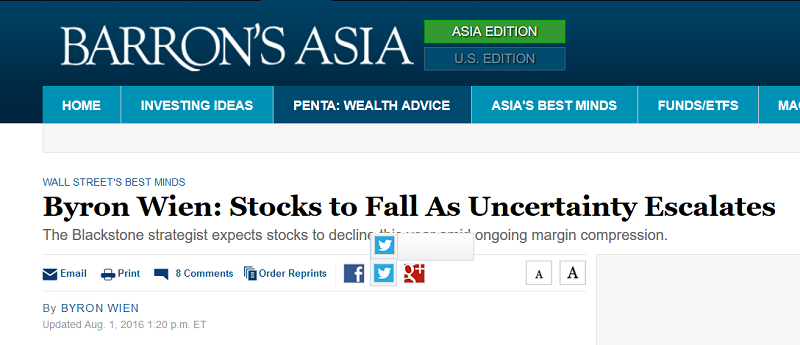
Byron Wien is a highly influential analyst at Blackstone Advisory Partners.
It’s mainly amateur investors who are focused on the supposedly grand “upside breakout” in the US stock market. In contrast, pros that move enormous amounts of liquidity like Wien don’t see any material upside to the market, and they are getting worried about the effect of wage pressures on inflation.
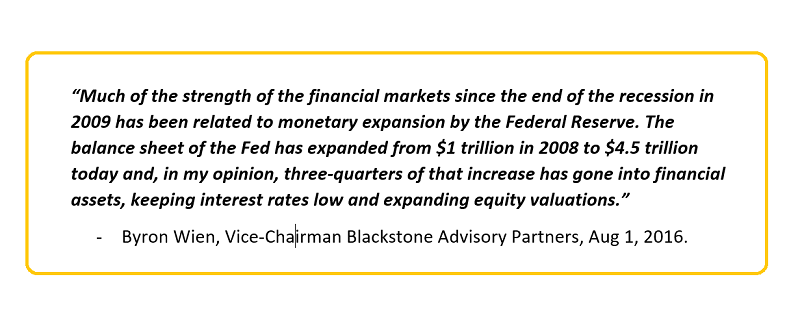
Wien clearly believes that roughly 75% of the Fed’s balance sheet has been used to support financial asset prices.
Now, with QE finished and wage pressures rising, the US stock market can only rise if earnings rise.
Stan Druckenmiller has also dire warnings for US stock market investors, and gold is his main currency. Goldman analysts have turned negative on the stock market as well. Seasonally, I refer to the August – October time frame as “crash season”.
Heavyweight analyst and investor Jeff Gundlach has just issued a massive “Sell everything except for gold bullion and gold stocks” signal.
This “parade of the institutional heavyweights into gold and out of equity markets” is occurring, ironically, while amateur investors line up to cheer the US stock market higher and higher, like cows lining up outside the slaughterhouse, all believing it’s going to be a wonderful life.
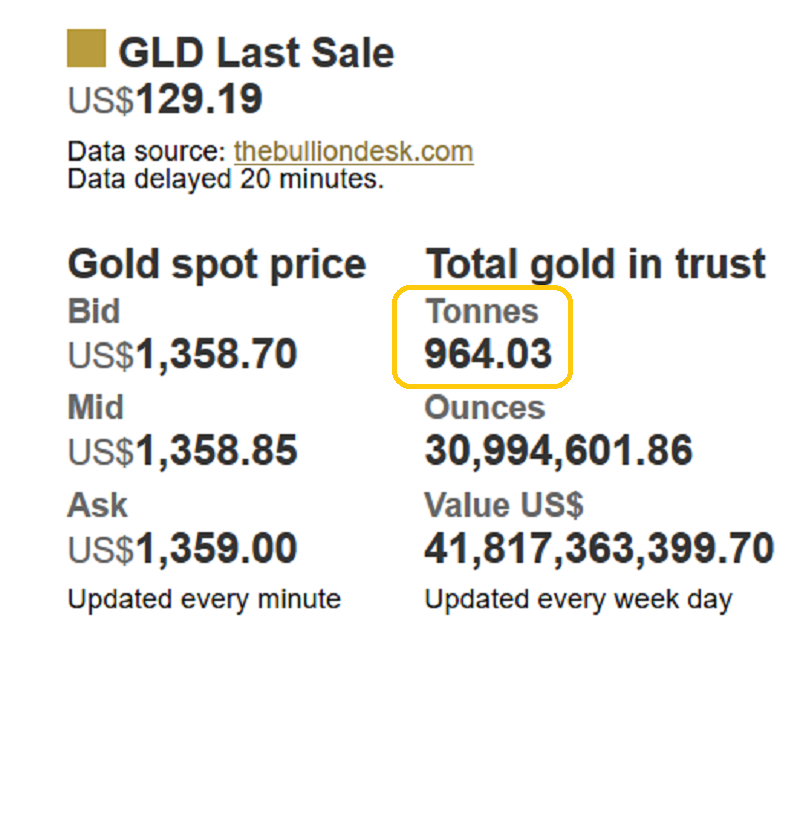
After consolidating a bit in the 950 tons area, the SPDR fund holdings have started to rise again, as more heavyweight institutional investors take action on the buy side!
I sometimes refer to Alan Greenspan as “The Golden Maestro”. He also warns of an imminent stagflationary firestorm.
I think all members of the Western gold community should own some silver. It doesn’t have to be a large amount, but owning some is a very good idea. Here’s why:
The gold:silver ratio has been in a range of about 80:1 to 40:1 since system risk has been the main fundamental theme in play.
Now, with inflation risk becoming the new main theme, I’m predicting the ratio will enter a new trading range, probably 40:1 to 10:1.
Silver can really shine when inflation becomes widely recognized against the background of a stagnant economy and a government entering an entitlements funding nightmare.
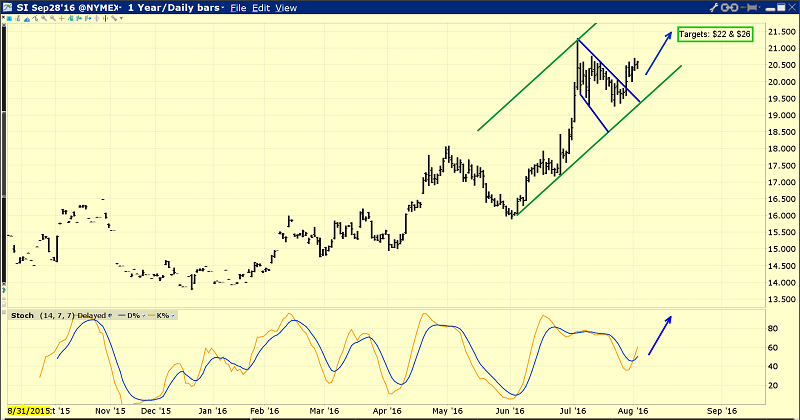
This is the daily silver chart. The momentum-style buy signal in play on the Stochastics oscillator is very encouraging, and it’s similar to the GDX buy signal.
A strong US jobs report that is met with dovish statements from Fed governors should be very good news for silver price enthusiasts around the world.
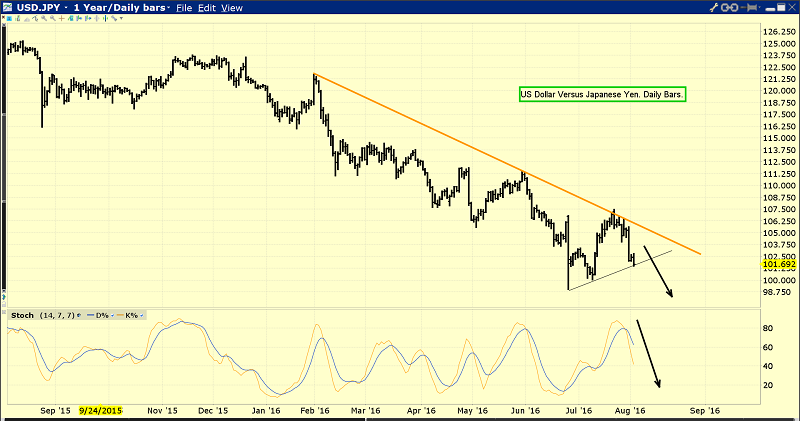
That’s the US dollar versus the Japanese yen chart. The tiny rally has failed, and the dollar is tumbling again. That’s helping push all the precious metals higher, and it may also highlight the immense danger facing US stock market investors!
Disclaimer:
Stewart Thomson is no longer an investment advisor. The information provided by Stewart and Graceland Updates is for general information purposes only. Before taking any action on any investment, it is imperative that you consult with multiple properly licensed, experienced and qualified investment advisors and get numerous opinions before taking any action. Your minimum risk on any investment in the world is: 100% loss of all your money. You may be taking or preparing to take leveraged positions in investments and not know it, exposing yourself to unlimited risks. This is highly concerning if you are an investor in any derivatives products. There is an approx $700 trillion OTC Derivatives Iceberg with a tiny portion written off officially. The bottom line:
Are You Prepared?
