- According to the most recent cyclical indicators, the strong growth reported in the Eurozone in Q1 is likely to be followed by a slowdown in Q2. We estimate Q2 growth at 0.2% q/q after 0.5% in Q1.
- Industrial output and retail sales were down strongly at the end of Q1.
- The loss of momentum can also be seen in the survey data, which are trending downwards.
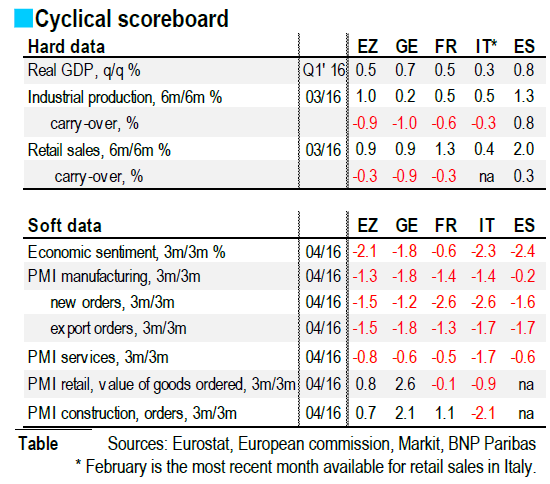
In order to assess the Q2 Eurozone growth outlook, after the robust Q1 figures, we review here the main economic indicators available to date, the hard data like industrial output and retail sales as well as various survey results for the soft data (see table). According to this dataflow, EMU growth is likely to be softer in Q2 than in Q1. Yet there is still a lot of uncertainty surrounding the size of the payback, given lots of data are still missing. We currently estimate Q2 GDP growth in the Eurozone at 0.2% q/q after 0.5% q/q in Q1 (the figures are the same for France).
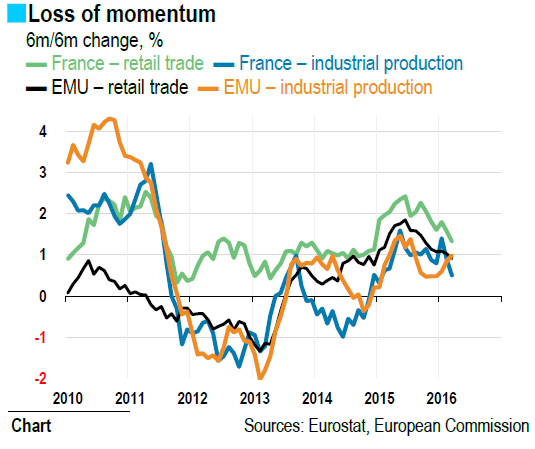
Industrial output and retail sales ended the first quarter on a negative note, which was more pronounced for industrial output than for retail sales. Spain is the only exception, with both indicators rising in March. Germany stands out on the downside and reported the most negative carry-over of the countries under review. As often is the case, France is situated in an in-between position. However, when measured at the end of a quarter, the carry-over provides only a vague idea of the trend of the next quarter. For the moment, Q2 seems to be off to a bad start, but the accuracy of this diagnosis still needs to be confirmed. Industrial output and retail sales short-term dynamics 1 (the momentum) provide an additional indication of the cyclical state of the economy. As of now, for the Eurozone as a whole, the trend is slightly positive for industrial output and negative for retail sales (see chart).
April confidence surveys also point to less buoyant cyclical dynamics, as their results have been trending downwards in recent months. This negative signal is reinforced by the deterioration of the leading components of the manufacturing PMI index, notably new orders and export orders. Yet not all of the items on the eurozone’s cyclical scoreboard are in negative territory: construction orders are still in positive territory in Germany and France. Although masked by the way momentum is calculated, Italy stands out for its strong turnaround in the European Commission’s economic sentiment indicator for April, which almost completely erased the decline between November and March. France reports a slightly smaller deterioration in its business climate indicators, albeit from a lowerlevel than elsewhere. The national surveys (INSEE, Bank of France) are also showing mixed signals, and are currently consistent with growth of about 0.3% q/q.


In the same way that Q1 growth was too strong to last, we expect the Q2 payback to be short lived. Eurozone growth should then return to a quarterly growth rate of 0.3-0.4%. This would bring the average annual growth rate to 1.5% in 2016, the same as in 2015, followed by 1.3% in 2017. Though lacking punch, the economy will nonetheless hold above its long-term growth potential.
by Hélène BAUDCHON
