“The beauty of simplicity is that it I so uncomplicated.” Anonymous
I couldn’t have said it better myself in 1,000 words.
When it comes to investing, I am fond of the phrase “It doesn’t have to be rocket science.” Let’s consider one, um, simple example.
The 60/40 NOT Method
Over the years one strategy that many investors have been drawn to involves (essentially, but with a number of potential variations) investing 60% in the stock market – often via an index fund – and 40% in the bond market. The underlying premise is that both assets will make money over the long-term and that – at least in theory – when one “zigs” the other will “zag” and in that in the process losses and volatility will be muted.
There are far more potential flaws in this theory than can be covered here, yet still the theory is fairly elegant and can “work” for people who want simplicity and no market timing.
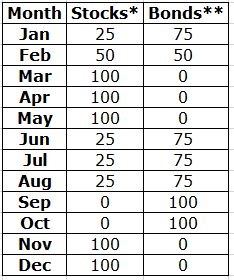
The 60/40 NOT Method utilizes seasonal trends to adjust the stock/bond allocation on a monthly basis. The allocation table appears in Figure 1.

Figure 1
As you can see in Figure 1, the allocation changes rather than using a fixed percentage. Again, this is based on the fact that stocks tend to perform better during certain times of the year.
The Test
*Method 1 involves reallocating between the two indexes as shown in Figure 1.
*Method 2 involves reallocating 60% to stocks and 40% to bonds on January 1st of each year, and then holding the rest of the year with no changes.
*For generating hypothetical results I used total monthly return data for the S&P 500 Index (for stocks) and the Bloomberg Barclays (LON:BARC) Capital U.S. Aggregate Bond Index (for bonds) starting in January 1976 through June 2018. No fees or commissions are deducted.
*Tickers SPY and AGG are ETFs that track these two indexes NOTE: the results below are generated using the indexes themselves and not the ETFs).
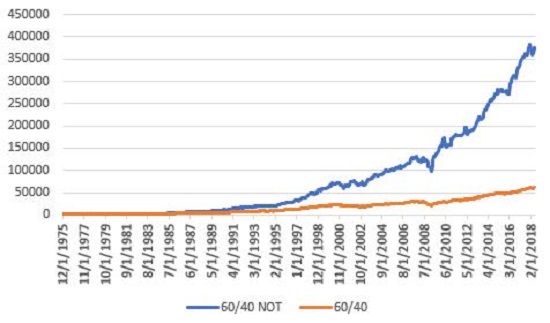
Figure 2 display the growth of $1,000 invested using Method 1 (blue line) versus Method 2 – the generic 60/40 method (orange line)

Figure 2
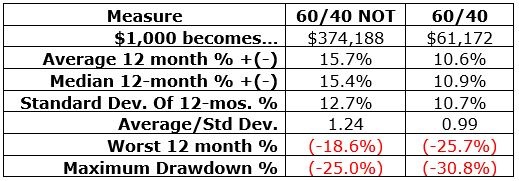
Figure 3 displays some comparative numbers.

Figure 3
The numbers seem to strongly favor the 60/40 NOT Method. However, as with all things a dose of reality is important. One key note involves taxes. The Traditional 60/40 Method would likely qualify for long-term capital gains as there is only trade (rebalancing to 60% stocks, 40% bonds) every 12 months. The 60/40 NOT Method would be all short-term gains as the long a given allocation is held is 3 months.
Therefore, for a taxable account, income taxes could easily eat up a lot of potential advantage.
Summary
Is the 60/40 NOT Method a viable alternative to the Traditional 60/40 Method? That’s for you the reader to decide.
