Get 40% Off
👀 👁 🧿 All eyes on Biogen, up +4,56% after posting earnings. Our AI picked it in March 2024.
Which stocks will surge next?
Unlock AI-picked Stocks

Remarkable Energy Chart

Published 12/30/2014, 12:17 AM
Updated 07/09/2023, 06:31 AM

At first sight, the following chart is pretty jaw dropping:
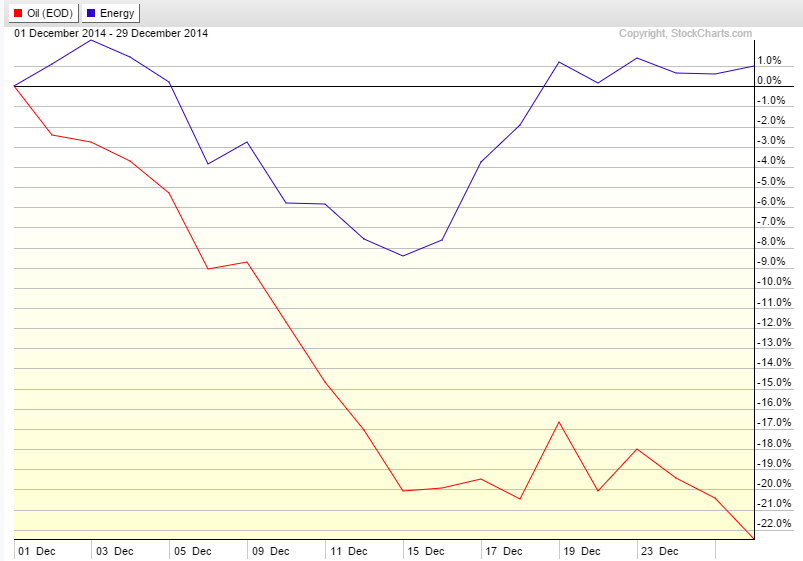
WTI vs XLE December 2014

Thus far in the month of December WTI crude oil is down more than 22% while the SPDR Energy Select Sector Fund (ARCA:XLE) is up 1%!

This tremendous out-performance by the large integrated energy companies that comprise the XLE (Chevron (NYSE:CVX), Exxon Mobil (NYSE:XOM), etc.) is actually explainable. First of all, most large oil producers have sizable hedge books with price floors (many of these floors are currently around $70/barrel) which hedge much of their production 12-18 months out. Therefore, crude oil’s decline during December (from around $70/barrel at the beginning of the month to below $54/barrel yesterday) does not have a huge near-term impact upon large integrated oil producers’ earnings.

Second, many analysts are forecasting a decent rebound in oil prices during 2015:Oil Price Forecast December 2012-June 2016
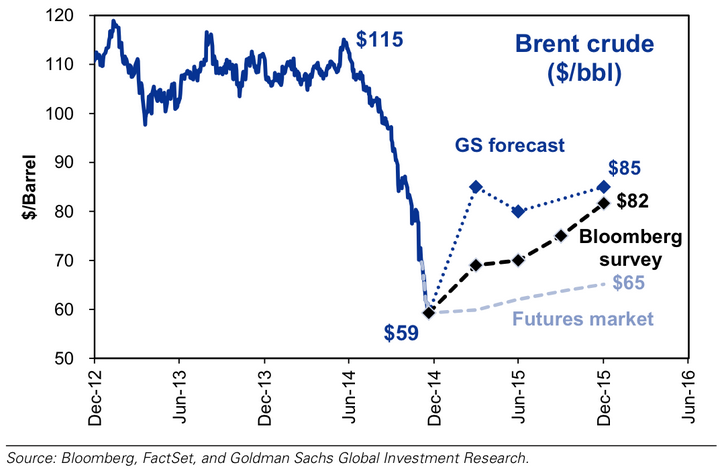
Even though the futures curve isn’t nearly as optimistic as Goldman Sachs or the analysts surveyed by Bloomberg, equity investors are siding with the analysts and also betting that cost containment efforts will help to buoy oil firms’ earnings in the new year.

Original post

Latest comments

Risk Disclosure: Trading in financial instruments and/or cryptocurrencies involves high risks including the risk of losing some, or all, of your investment amount, and may not be suitable for all investors. Prices of cryptocurrencies are extremely volatile and may be affected by external factors such as financial, regulatory or political events. Trading on margin increases the financial risks.
Before deciding to trade in financial instrument or cryptocurrencies you should be fully informed of the risks and costs associated with trading the financial markets, carefully consider your investment objectives, level of experience, and risk appetite, and seek professional advice where needed.
Fusion Media would like to remind you that the data contained in this website is not necessarily real-time nor accurate. The data and prices on the website are not necessarily provided by any market or exchange, but may be provided by market makers, and so prices may not be accurate and may differ from the actual price at any given market, meaning prices are indicative and not appropriate for trading purposes. Fusion Media and any provider of the data contained in this website will not accept liability for any loss or damage as a result of your trading, or your reliance on the information contained within this website.
It is prohibited to use, store, reproduce, display, modify, transmit or distribute the data contained in this website without the explicit prior written permission of Fusion Media and/or the data provider. All intellectual property rights are reserved by the providers and/or the exchange providing the data contained in this website.
Fusion Media may be compensated by the advertisers that appear on the website, based on your interaction with the advertisements or advertisers.
© 2007-2024 - Fusion Media Limited. All Rights Reserved.