Risk trades (buying equity indices, selling yen and Treasuries) continue to make big swings, highlighting the importance of technical signals. We highlight some key levels to watch. +1000 Dow 30 points over the last 2 days sums up the mood in indices. Although the Australian dollar was the top performer Wednesday (CHF was the laggard), the magnitude of the move was small. We would have expected better, especially if this was truly the market signaling China's containnment of the coronavirus.
On that front, fanciful rumors did the rounds about a 'cure' but scientists dashed that talk, while remaining optimistic that HIV drugs could help spare lives.
Early Wednesday, Hubei province reported 2,987 new cases; down from 3,156 a day earlier in the first daily decline since the outbreak. That may reflect a lack of test kits but on the surface it's genuinely good news, even with total cases approaching 30,000. What next? No one can predict a pandemic but some technical levels in market could indicate what's coming next.
Some key levels
AUD/USD is certainly one. It has climbed 75 pips above the major bottom near 0.6675 but it will need to get all the way back above the 200-day moving average at 0.6860 to generate a truly positive signal.
With regards to USD/JPY, have a look at this chart from the earlier IMT.
EUR/USD: A fight that will be settled much sooner is in EUR/USD, which continues to move inverse to the risk trade. It came within 2 pips of the 2020 low of 1.0992 on Wednesday and the November low of 1.0981 is just below that. If those levels in the euro break, it may come at the same time as a further rally in the S&P 500. It rose to within a point of a fresh all-time high on Wednesday and a decisive breakout would also send a positive signal for yen crosses.
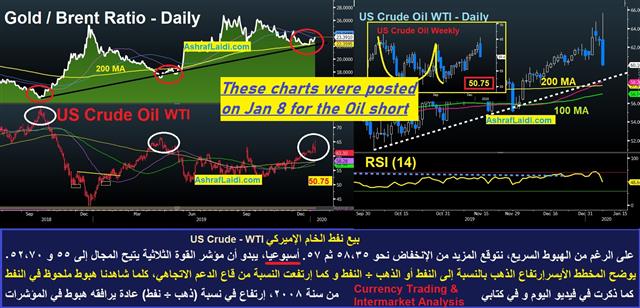
U.S. Crude Oil: WTI Crude oil rejected a decisive break of $50 so far, largely seen as the low of a triple top target. The OPEC+ technical committee is meeting for a third day on Thursday and if they recommend a 200k bpd cut or take a wait-and-see approach; the selling pressure could mount again. Upside seen cappped at 53.8/54.00 for now. The chart below are from the Premium Insights' Jan 8th trade to short oil at 59.65, which was closed at 52.55.

