
On February 27, 2013, Williams Partners, L.P. (WPZ) provided its 2012 annual report on Form 10-K. Results compared unfavorably to the prior year and even to the most recent guidance. In what is becoming an unwelcome routine, management again lowered Distributable Cash Flow (“DCF”) guidance for 2013-2014, as indicated in Table 1 below: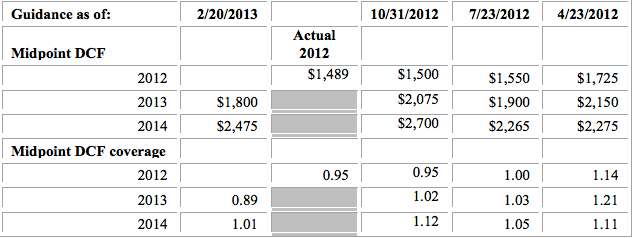
In November 2012, WPZ completed the $2.36 billion acquisition of an 83.3% interest in the Geismar Olefins-Production Facility from Williams Companies, Inc. (WMB) and issued WMB ~42.8 million units to pay for this acquisition (i.e., virtually an all equity deal). WMB is WPZ’s general partner and, following the Geismar acquisition, owns a ~68% limited partner interest, a 2% general partner interest and incentive distribution rights (“IDRs”).
Located south of Baton Rouge, Louisiana, the Geismar facility is a light-end NGL cracker with current volumes of 39,000 barrels per day (bpd) of ethane and 3,000 bpd of propane and annual production of 1.35 billion pounds of ethylene. With the benefit of an expansion under way and scheduled for completion by late 2013, the facility’s annual ethylene production capacity will grow by 600 million pounds to 1.95 billion pounds. Since the owner of the remaining ownership interest in the facility is not participating in the expansion, WPZ’s overall undivided interest following the expansion will be ~ 88%. The Geismar acquisition is expected to bring more certainty to cash flows that are currently exposed to volatile ethane prices by shifting the commodity price exposure to ethylene. The transaction reduces WPZ’s ethane exposure by 70% in 2013 and fully eliminates it by 2014 (when WPZ will effectively be short ethane).
The Geismar dropdown contributed $42 million of DCF in the first two months following the acquisition (Nov-Dec). My back-of-the-envelope calculation annualizes to ~$250 million per annum, or $360 million with a ~44% capacity expansion. This is probably way too rough an estimate, but I will closely watch Geismar contributions in future periods because there is a significant gap between my number and management’s 2014 estimate of $570 million in segment profit plus depreciation and amortization.
Ethane exposure contributed significantly to the poor 2012 results. The sharp decline in prices (down 46% in 4Q12) for natural gas liquids (“NGL”) reduced processing margins, led to ethane rejection and thus generated lower equity volumes under keep-whole agreements and percent-of-liquids arrangements. WPZ’s Midstream segment provides natural gas gathering and processing services under fee contracts (volumetric-based), keep-whole agreements and percent-of-liquids arrangements. A glossary of terms provides further explanations of these terms and of ethane rejection. Under keep-whole and percent-of-liquid processing contracts, the Midstream segment retains the rights to all or a portion of the NGLs extracted from the producers’ natural gas stream (these are the equity volumes referred to above). It recognizes revenues when the extracted NGLs are sold and delivered. Lower NGL prices coupled with lower volumes produce lower revenues, as well as sharply lower operating income and net income, as seen in Table 2 below: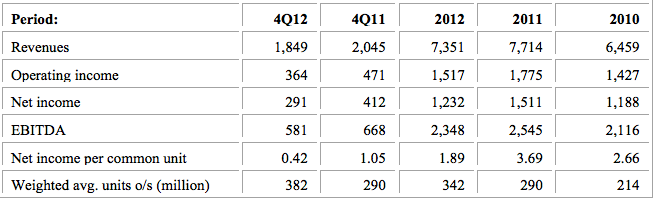
I have not analyzed results by segment because, beginning November 2012, operations related to the Geismar acquisition (manufacture of olefin products) were incorporated in what was known as the Midstream segment and revenues began to be broken down differently than they were before (into service revenues and product sales). Costs and operating expenses also began being categorized differently than they were in the past. Furthermore, management implemented a new structure, effective January 1, 2013, that reorganizes the businesses into geographically based operational areas, as set forth below in WPZ’s Form 10-K for 2012: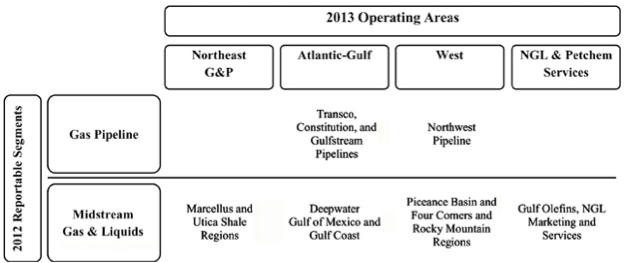
I expect the new segment reporting format will be reflected in the 1Q13 report.
The numbers reported by WPZ and appearing in Table 2 have been recast for the Geismar acquisition. As a result, net income increased by $185 million, $133 million and $87 million for the years ended 2012, 2011, and 2010, respectively. Earnings per unit and DCF were not impacted as pre-acquisition earnings and cash flows were allocated to WMB.
In an article titled Distributable Cash Flow (“DCF”) I present the definition of DCF used by WPZ and provide a comparison to definitions used by other master limited partnerships (“MLPs”). Using WPZ’s definition, DCF for the trailing twelve month (“TTM”) period ending 12/31/12 was $1,489 million ($4.35 per unit), down from $1,650 in the comparable prior year period ($5.68 per unit). As always, I first attempt to assess how these figures compare with what I call sustainable DCF for these periods and whether distributions were funded by additional debt or issuing additional units.
The generic reasons why DCF as reported by the MLP may differ from what I call sustainable DCF are reviewed in an article titled Estimating Sustainable DCF-Why and How. Applying the method described there to WPZ results through 12/31/12 generates the comparison outlined in Table 3 below: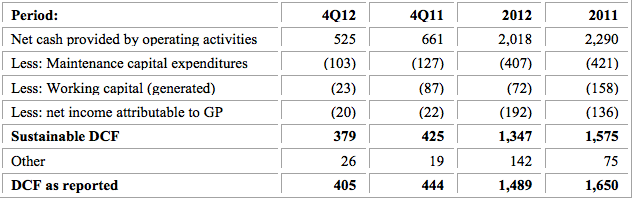
The gap between reported DCF and sustainable DCF shown under “other” is comprised principally items that management adds back in deriving reported DCF. These include acquisition-related and reorganization-related costs, certain reimbursements from WMB and the excess cash flow over earnings from WPZ’s equity investments. But overall, the differences between reported and sustainable DCF are not huge.
Despite the deterioration in key performance parameters, WPZ increased 4Q12 distribution to $0.8275 per unit (up 2.5% from $0.8075 in 3Q12 and up 8.5% from $0.7625 in 4Q11). Coverage ratios in Table 4 below are therefore shown based on actual distributions made (e.g., the distribution announced for 3Q12 was actually made in 4Q12) and based on declared distributions (e.g., assuming the distribution declared 4Q12 was made in 4Q12):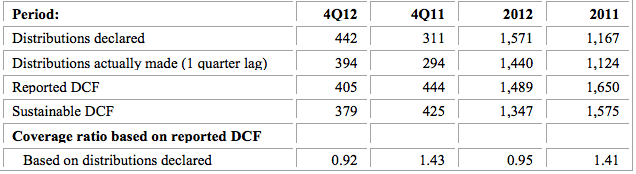
The sharply lower coverage ratios reflect the decline in NGL prices and, to a lesser extent, higher G&A expenses. While I did not anticipate the decline in NGL prices, I did mention in a prior article (dated May 24, 2012) the risk of lower coverage ratios resulting from the rapid growth in the number of units outstanding as a result of issuing equity to partially finance large drop-down acquisitions. Indeed, this has been a major contributing factor as can be seen in Table 2. The number of units outstanding has increased 31% from 4Q11. Management expects coverage ratios will remain negative (below 1) in 2013 and to just cover distributions in 2014 (see Table 1). The assumptions regarding how many additional limited partner units management expects to issue in 2013-2014 have not been disclosed.
I am not comfortable with the practice of increasing distributions in the face of declining coverage and believe unitholders would be better off seeing distributions held steady and fewer shares being issued.
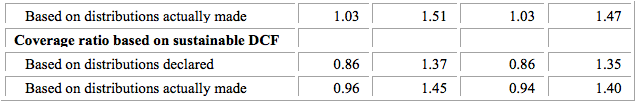
It is helpful to look at a simplified cash flow statement by netting certain items (e.g., acquisitions against dispositions) and by separating cash generation from cash consumption. Here is what I see for WPZ:

Net cash from operations, less maintenance capital expenditures, less cash related to net income attributable to non-partners exceeded distributions by $171 million in 2012 and by $745 million in 2011. In 4Q12 the excess was minimal and, since these numbers reflect distributions actually made rather than declared, I expect a shortfall in the current quarter (as was the case in 3Q12). This will indicate that distributions are being funded through the issuance of additional equity. Management expects this to continue in 2013.
Given that poor operational performance has been coupled with an unrelenting pace of equity issuances ($490 million in 1Q12, $1,581 million in 2Q12, $488 million in 3Q12 and ~$635 million so far in 1Q13), it is not surprising that the price per unit has languished and is down ~18% from ~$60 on December 30, 2011 to $49.10 as of 3/8/13). Table 5 shows there has also been a significant increase in debt. WPZ ended 2012 with long term debt at ~3.6x EBITDA, an increase over the ~2.8x multiple at the end of 2011. Although this level does not appear to be excessive, it could move higher even absent debt issuances should EBITDA levels continue to decline. Planned capital investments for 2013 total ~$ 3.4 billion (excluding maintenance expenditures), virtually all of which will need to be funded through debt and equity issuances. There could therefore be additional pressure on unit prices.
Of the MLPs I follow, WPZ has the third largest market capitalization (after EPD and KMP). Its cost of capital is much higher than that of EPD, among other reasons due to WMB’s IDRs. KMP is also burdened with a higher cost of capital due to its structure. I prefer WPZ to KMP because I think it has superior growth opportunities and presents better value at these price levels. A comparison of WPZ’s yield to that of the other MLPs I follow is presented in Table 6 below: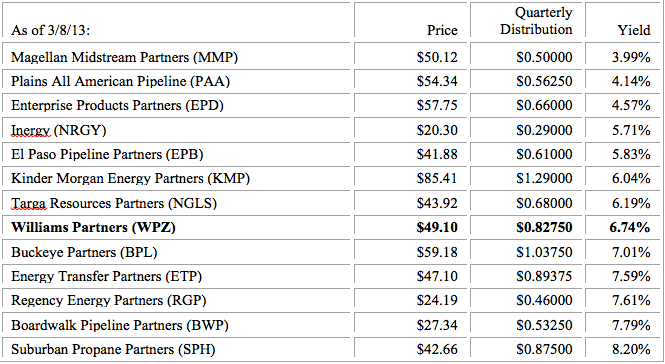
Despite the recent signs of weakness I have been adding to my WPZ position on pullbacks (and initiated a position in WMB) for the following reasons: 1) Low natural gas prices are incorporated into the 203-2014 guidance numbers; 2) while the Caiman Eastern acquisition will require ~$1.34 billion in capital expenditures from 2012-2014, management projects segment profit plus depreciation and amortization in 2014 to more than double the 2013 level and exceed $400 million; 3) the benefits of the Geismar facility expansion currently under way are projected to be very significant. Management estimates segment profit plus depreciation and amortization in 2014 (the first year of post-expansion operations) to total $570 million, a modest 4.4 multiple of the purchase price plus the additional $270 million of post-closing capital expenditures; and 5) between 2012 and 2014 WPZ will have invested ~$12 billion in growth capital, ~$6.3 billion of which is in the Marcellus and Utica shales. Management projects fee-based revenues will increase to ~77% of business by 2014 (from 68% in 2012).
Management has, in the past, consistently run significant excess DCF coverage. Its decision to significantly dilute unitholders in executing two transformative transactions, in conjunction with an adverse NGL pricing environment, has turned the excess into a shortfall. Unit price has declined significantly and presents a buying opportunity for investors whose faith in management is intact and who are willing to wait until 2014 when results will show whether such faith was justified. But I allocate less to WPZ/WMB than to EPD, EPB or PAA.
- English (UK)
- English (India)
- English (Canada)
- English (Australia)
- English (South Africa)
- English (Philippines)
- English (Nigeria)
- Deutsch
- Español (España)
- Español (México)
- Français
- Italiano
- Nederlands
- Português (Portugal)
- Polski
- Português (Brasil)
- Русский
- Türkçe
- العربية
- Ελληνικά
- Svenska
- Suomi
- עברית
- 日本語
- 한국어
- 简体中文
- 繁體中文
- Bahasa Indonesia
- Bahasa Melayu
- ไทย
- Tiếng Việt
- हिंदी
A Look At Williams Partners’ Distributable Cash Flow
Published 03/11/2013, 02:43 PM
Updated 07/09/2023, 06:31 AM
A Look At Williams Partners’ Distributable Cash Flow
3rd party Ad. Not an offer or recommendation by Investing.com. See disclosure here or
remove ads
.
Latest comments
Install Our App
Risk Disclosure: Trading in financial instruments and/or cryptocurrencies involves high risks including the risk of losing some, or all, of your investment amount, and may not be suitable for all investors. Prices of cryptocurrencies are extremely volatile and may be affected by external factors such as financial, regulatory or political events. Trading on margin increases the financial risks.
Before deciding to trade in financial instrument or cryptocurrencies you should be fully informed of the risks and costs associated with trading the financial markets, carefully consider your investment objectives, level of experience, and risk appetite, and seek professional advice where needed.
Fusion Media would like to remind you that the data contained in this website is not necessarily real-time nor accurate. The data and prices on the website are not necessarily provided by any market or exchange, but may be provided by market makers, and so prices may not be accurate and may differ from the actual price at any given market, meaning prices are indicative and not appropriate for trading purposes. Fusion Media and any provider of the data contained in this website will not accept liability for any loss or damage as a result of your trading, or your reliance on the information contained within this website.
It is prohibited to use, store, reproduce, display, modify, transmit or distribute the data contained in this website without the explicit prior written permission of Fusion Media and/or the data provider. All intellectual property rights are reserved by the providers and/or the exchange providing the data contained in this website.
Fusion Media may be compensated by the advertisers that appear on the website, based on your interaction with the advertisements or advertisers.
© 2007-2024 - Fusion Media Limited. All Rights Reserved.