
Commentary
Bulls could not ask for a better end to trading last week. T2108 closed at 50% after trading as low as 26%. The S&P 500 (SPY) made a sharp reversal from a (false) 50DMA breakdown. This move was so strong that at one point, the index was flirting with a fresh all-time high!
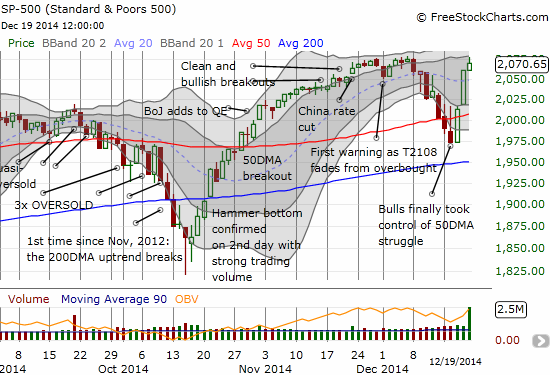
The S&P 500 ends the week on the tail-end of a dramatic turn-around from a 50DMA breakdown
The rally on Thursday was so strong that I actually managed to flip a double on ProShares Ultra S&P500 (ARCA:SSO) call options on the same day. Following the strategy I outlined in the last T2108 Update, I assumed that Thursday’s strong open validated Wednesday’s 50DMA breakout.
I immediately loaded up on call options and also set a limit order for more in case the market delivered a pullback. Instead, the market never looked back and left me of course wishing I had been bold enough to buy my entire Christmas wishlist right from the beginning!
The S&P 500 gained a whopping 2.4% on the day. According to Reuters, this was the S&P 500’s second best one-day performance since 2011. Notice an important implication: despite a stock market that consistently makes new highs, the rally is not unfolding in huge daily run-ups and leaps. This is a market that is slow-dripping its way higher.
Amazingly, bulls have been granted plenty of opportunities to buy dips at a “comfortable” pace…and bears have been tricked into plenty of opportunities for getting faked out. In other words, the trend remains the friend of bulls while bears have had to do quick “two-steps” in front of the steamroller…
Interestingly, the Volatility Index did NOT plunge further. I suspect this has something to do with the quadruple witching day of Friday with options and futures expiration. so, today and into Christmas should feature a continuation of volatility’s latest plunge.

Despite the continued rally in the S&P 500,, the volatility index manages to cling to support at its 50DMA
As I have done in the past, I sold my shares in ProShares Short VIX Short-Term Futures ProShares Short VIX Short-Term Futures (ARCA:SVXY) soon after Thursday’s open when it looked like initial momentum had waned. I am of course glad I held through Wednesday’s big post-Fed volatility implosion.
As T2108 continues to rise from here, I will be shifting my focus to (ARCA:SSO) call options instead of volatility plays. To me, the biggest bang for the buck on fading volatility was just ahead of the Federal Reserve meeting.

Despite the continued rally in the S&P 500, ProShares Short VIX Short-Term Futures (SVXY) stalls
In the currency market, a bounce in the Australian dollar (NYSE:FXA) against the Japanese yen, (via Rydex CurrencyShares Japanese Yen Fund (ARCA:FXY)) has confirmed the bounce in the stock market. Even more impressive was the picture-perfect bounce off 50DMA support for the U.S. dollar versus the Japanese yen.

The Australian dollar confirms the stock market’s renewed bullishness with its own bounce that quickly invalidates the 200DMA breakdown

USD/JPY pirouettes through a picture-perfect test of its 50DMA
Finally, one stock chart to review: Alibaba Group Holding Limited (NYSE:BABA). Could the “Ali Rah Rah” pop be resuscitated in time for a year-end flourish? I sure hope so. I bought the breakout from the downtrend. Friday’s surge from the lows of the day is also very encouraging. BABA is now above its 20DMA again and looks ready to rip with that trendline turning upward again.

Alibaba Group Holding Limited (BABA) continues its breakout from the recent downtrend off all-time highs
So it looks like “everybody” is gettin’ sump’n for Christmas after all (except maybe the bears). Read “The Numbers And Setup Behind This Year’s Potential Santa Claus Rally” for my run of the numbers supporting the tendency for the S&P 500 to rally in the second half of December.
Daily T2108 vs the S&P 500")
Black line: T2108 (measured on the right); Green line: S&P 500 (for comparative purposes)
Red line: T2108 Overbought (70%); Blue line: T2108 Oversold (20%)
Weekly T2108
Be careful out there!
Disclosure: long BABA, short AUD/JPY (mainly as a short-term hedge – I remain VERY bearish on the Japanese yen!)