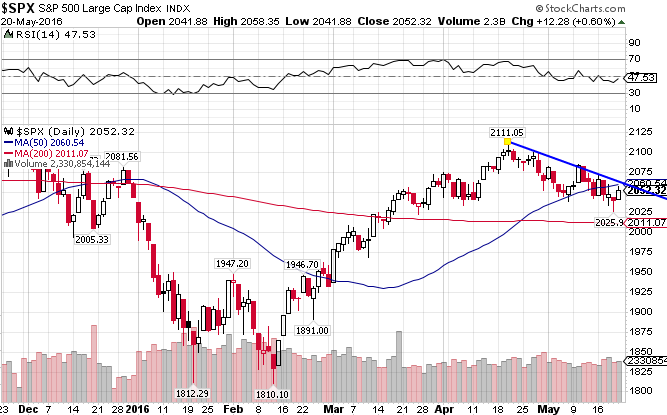
After a volatile but stagnant final two months of the year, in which the market straddled the moving averages with no clear direction, the S&P 500 Index (NYSE:IVV) broke down in early January, before stabilizing at the 1800 level. After testing and holding support in mid-February, the index rebounded to the 2100 level, breaking through both moving averages and coming to within a couple percentage points from a new all-time high. It has since consolidated gains but sits firmly above strong support at the 200-day moving average. The S&P 500 is up 1.37% year-to-date after posting a gain of just over 1% in 2015.
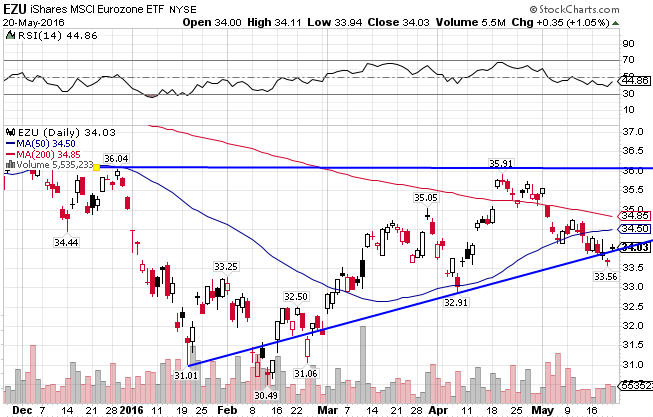
The EMU Index ((NYSE:EZU)), or the European Economic and Monetary Union, hasn’t fared as well as its US counterpart. Its stock market hasn’t recovered with the same ferocity since the dip in the beginning of the year. Europe has been consistently underperforming the US for some time now, after outperforming for the first part of last year. The index is down 2.87% for all of 2016.
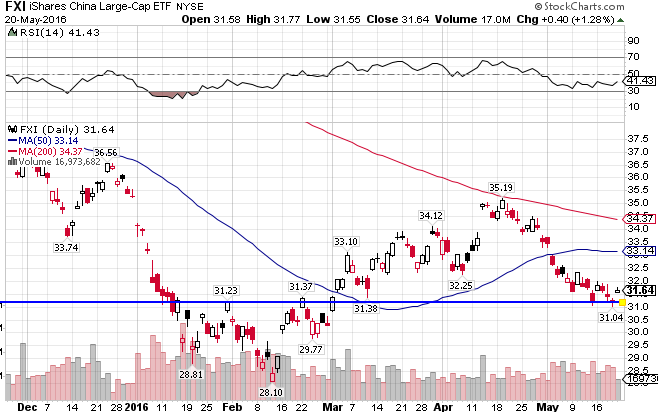
After a huge “irrationally exuberant” run and subsequent collapse last year, the Chinese markets ((NYSE:FXI)) have gone nowhere fast. The index fell off a cliff at the beginning of the year, creating a huge gap under the 35 level, and while it fully rebounded and “filled the gap”, it has subsequently failed at resistance and came crashing down again. The China Large Cap index is now down 10.34% in 2016.
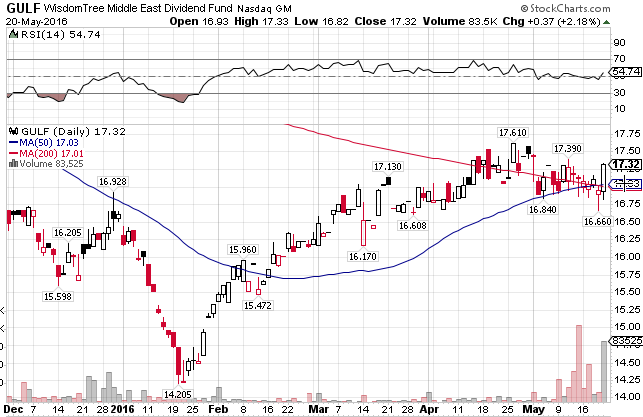
Due to a weakening US dollar, a somewhat subdued ISIS, and rebounding crude oil prices, the Middle East Index ((NASDAQ:GULF)) has rebounded significantly from its lows set in January. Technically, the 50-day MA recently crossed over the 200-day MA, in what is known as a golden cross. This tends to be a positive indicator, and with the index breaking out this past Friday, this seems to be coming to fruition. The index is up 4.28% since the beginning of the year.
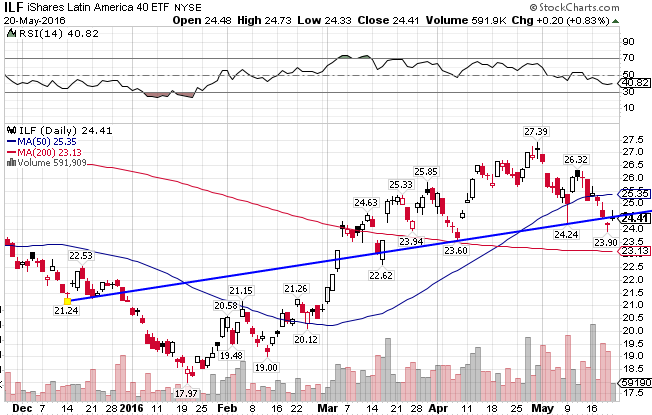
Another region hit hard by the commodity bust. And another region that has had a remarkable run in the first part of the year. The Latin American market ((NYSE:ILF)) broke down in May and August of last year, and again in December. But since then, it has been on a tear, breaking above both moving averages befoe consolidating gains. It has moved concurrently with the crashing commodities market and now while it’s been surging. The index has recorded an impressive 15.20% gain this year.
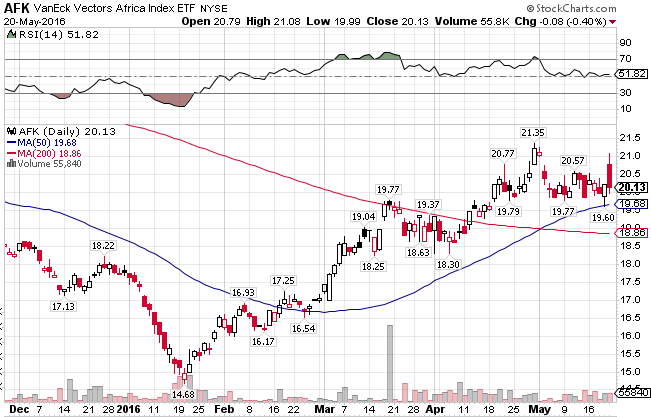
Africa’s market ((NYSE:AFK)) had been hurt by continued upheaval in Northern Africa and Nigeria, coupled with a weak global economy and a worsening political climate in South Africa. It has since rebounded in the coattails of the commodity surge. The index is up 13.15% for 2016.
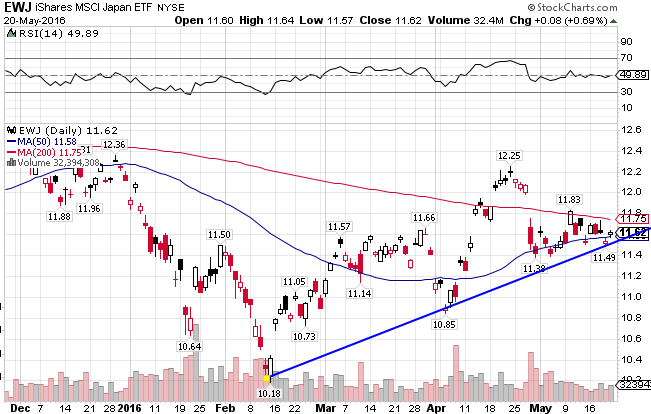
Technically, Japan ((NYSE:EWJ)) is solidly in an uptrend after having broken support at the 11 level. It now finds itself coming close to the aforementioned golden cross. Japan is down 4.13% YTD, after being the best performing market in 2015.
