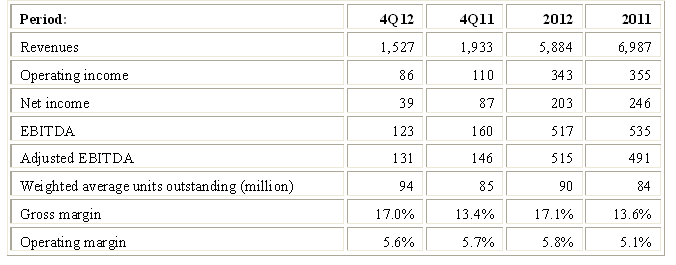
On February 14, 2013, Targa Resources Partners LP (NGLS) reported results of operations for 1Q 2012 and 2012. Certain key operating parameters for 4Q 2012 and for 2012, including revenues, operating income, net income and earnings before interest, depreciation & amortization and income tax expenses (EBITDA), are summarized in Table 1:
NGLS’ revenues are principally derived from percent-of-proceeds (“POP”) contracts, under which it receives a portion of the natural gas and/or natural gas liquids as payment for its gathering and processing services. POP contracts share price risk between the producer and processor. Operating income generally increases as natural gas prices and natural gas liquid prices increase, and decreases as they decrease.
4Q12 revenues decreased by $407 million vs. the prior year period due to hedges and lower realized prices on commodities ($591 million), partially offset by higher commodity sales volumes ($151 million) and higher fee-based and other revenues ($33 million). Revenues for 2012 decreased by $1,103 million vs. the prior year period due to hedges and lower realized prices on commodities ($1,963 million). This was partially offset by higher commodity sales volumes ($770 million) and higher fee-based and other revenues ($90 million). Other factors adversely impacting operating income and net income vs. the comparable prior year periods include higher operating expenses (due to acquisition and expansion activities), higher G&A expenses (due to increased compensation), as well as higher interest and depreciation expenses.
Management’s 2012 guidance for Adjusted EBITDA was $515-$550 million. NGLS was able to reach the low end of its target despite 25% lower NGL prices than its original assumptions, despite an $8 million impact from Hurricane Isaac and $6 million worth of transaction-related expenses for the Bakken Shale Midstream acquisition (Saddle Butte Pipeline, renamed Targa Badlands).
The definition of DCF used by NGLS provides a comparison to definitions used by other master limited partnerships (“MLPs”). Using NGLS’ definition, DCF for 2012 was $354 million ($3.92 per unit) vs. $337 million ($4.00 per unit) in the comparable prior year period. As always, I first attempt to assess how these figures compare with what I call sustainable DCF for these periods, and whether distributions were funded by additional debt or issuing additional units.
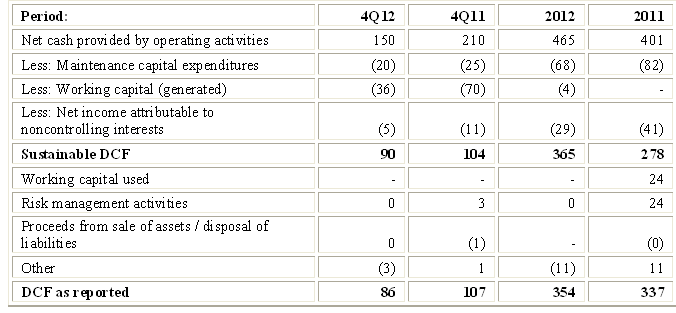
The generic reasons why DCF as reported by an MLP may differ from sustainable DCF are reviewed in an article titled Estimating Sustainable DCF-Why and How. Applying the method to NGLS’ results through 9/30/12 generates the comparison outlined in Table 2 below: 
The principal differences between reported and sustainable DCF for 2012 are grouped under “Other”. They relate to non-cash compensation and accretion of retirement obligations which management adds back to derive reported DCF, but are not included in my definition of sustainable DCF. The amounts for the period are not material. The principal differences between sustainable and reported DCF numbers for 2011 are attributable to working capital consumed and risk management activities.
Distributions, reported DCF, sustainable DCF and the resultant coverage ratios are as follows: 
Coverage ratio for 2012 was solid. The drop in 4Q12 is unrelated to the Targa Badlands acquisition. Rather it mostly reflects the drop in net cash generated by operating activities and the increase in number of units outstanding. I previously noted that NGLS was acquiring Targa Badlands at an expensive EBITDA multiple, and that the effect would be dilutive. Management now expects distribution coverage to be ~ 0.9x in the first half of 2013, and average 1.0x in 2013 due to the dilutive effect of Badlands. However, these lower coverage ratios will also reflect 10%-12% increases in projected distributions for 2013. Badlands is expected to be accretive in 2014 and beyond.
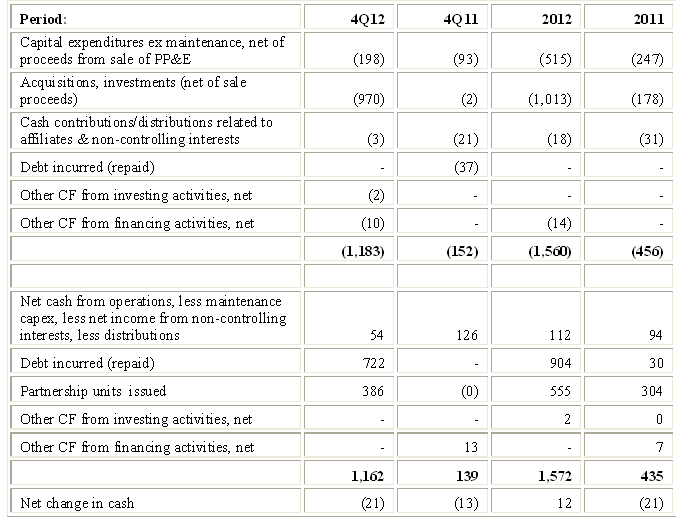
I find it helpful to look at a simplified cash flow statement that nets certain items (e.g., acquisitions against dispositions, debt incurred vs. repaid), and separates cash generation from cash consumption to obtain a clear picture of how distributions have been funded in the last two years. Here is what I see for NGLS:
Simplified Sources and Uses of Funds 
Net cash from operations, less maintenance capital expenditures, less cash related to net income attributable to non-partners exceeded distributions by $54 million in 4Q12 and by $112 million in 2012. Debt and equity issued were used for expansion capital expenditures and acquisitions.
NGLS spent $408 million on acquisitions and growth projects in 2011, $540 million in 2012 (excluding the $950 million Targa Badlands acquisition consummated 12/31/12), and estimates it will spend ~$1 billion in 2013. Projects representing aggregate investments in excess of $1.1 billion of organic growth capital will be placed in service in 2013 (mostly in the 2nd half of the year). Management expects 2013 Adjusted EBITDA to be $600-$650 million and to increase by 25% in 2014.
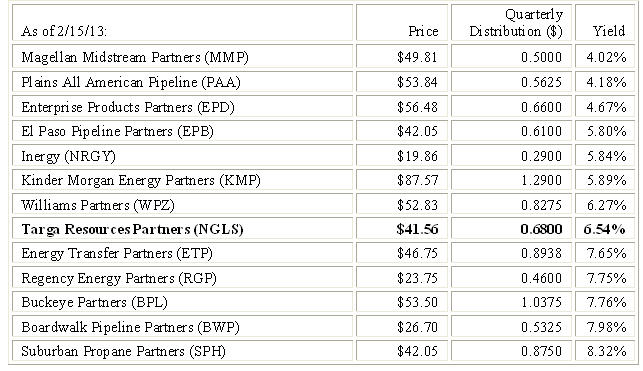
Table 5 below compares NGLS’ current yield of some of the other MLPs I follow: 
NGLS’ current yield of 6.54% compares favorably with many of the MLPs. I believe NGLS is a better choice and offers a more compelling risk-reward tradeoff. I am less sure regarding comparison to the others. My concerns center on the expensive acquisition, the low coverage ratio, the high cost of the IDRs, and the still significant exposure to commodity prices. I also believe developing the infrastructure for the Bakken shale is riskier than the Texas shale plays and the Marcellus shale.
- English (UK)
- English (India)
- English (Canada)
- English (Australia)
- English (South Africa)
- English (Philippines)
- English (Nigeria)
- Deutsch
- Español (España)
- Español (México)
- Français
- Italiano
- Nederlands
- Português (Portugal)
- Polski
- Português (Brasil)
- Русский
- Türkçe
- العربية
- Ελληνικά
- Svenska
- Suomi
- עברית
- 日本語
- 한국어
- 简体中文
- 繁體中文
- Bahasa Indonesia
- Bahasa Melayu
- ไทย
- Tiếng Việt
- हिंदी
A Closer Look: Targa Resources Partners’ Distributable Cash Flow
Published 02/20/2013, 05:18 AM
Updated 07/09/2023, 06:31 AM
A Closer Look: Targa Resources Partners’ Distributable Cash Flow
Latest comments
Loading next article…
Install Our App
Risk Disclosure: Trading in financial instruments and/or cryptocurrencies involves high risks including the risk of losing some, or all, of your investment amount, and may not be suitable for all investors. Prices of cryptocurrencies are extremely volatile and may be affected by external factors such as financial, regulatory or political events. Trading on margin increases the financial risks.
Before deciding to trade in financial instrument or cryptocurrencies you should be fully informed of the risks and costs associated with trading the financial markets, carefully consider your investment objectives, level of experience, and risk appetite, and seek professional advice where needed.
Fusion Media would like to remind you that the data contained in this website is not necessarily real-time nor accurate. The data and prices on the website are not necessarily provided by any market or exchange, but may be provided by market makers, and so prices may not be accurate and may differ from the actual price at any given market, meaning prices are indicative and not appropriate for trading purposes. Fusion Media and any provider of the data contained in this website will not accept liability for any loss or damage as a result of your trading, or your reliance on the information contained within this website.
It is prohibited to use, store, reproduce, display, modify, transmit or distribute the data contained in this website without the explicit prior written permission of Fusion Media and/or the data provider. All intellectual property rights are reserved by the providers and/or the exchange providing the data contained in this website.
Fusion Media may be compensated by the advertisers that appear on the website, based on your interaction with the advertisements or advertisers.
© 2007-2024 - Fusion Media Limited. All Rights Reserved.
