
During the final blow-off stage for silver in April of 2011, we caught our fair share of criticism and rebuke for pointing out what appeared to be a terminal run for the silver bullet. We heard from many of the usual suspects that in one breath marginalized our analysis as nothing more than technical mysticism, then went on to cite truly false and misleading fundamental comparisons as rational for further gains. Rampant inflation, rampant quantitative easing - rampant debasement! With time as the great revelator - mostly rampant ignorance.
With that said and considering silver and gold have languished back towards their late June lows, we thought we'd check back in on a comparative chart we first made in May 2011 after silver had broken down. While we had relied on more acute comparatives as guideposts in the road during the initial break - we took a broad-brush look at the last great momentum cycle that culminated in the Nasdaq, circa 2000. Not surprisingly, the two assets - both from a momentum and relative performance perspective, expressed notable similarities.
Nearly 30 months out from our initial chart, Carlos Slim's timely placed hedges on his own silver production appear to have been presciently purchased. And although the magnitude of silver's decline came up a bit short, the timeline for a mid 2013 cycle low and the structure of the turn (W bottom) still compare closely with how silver has performed today. 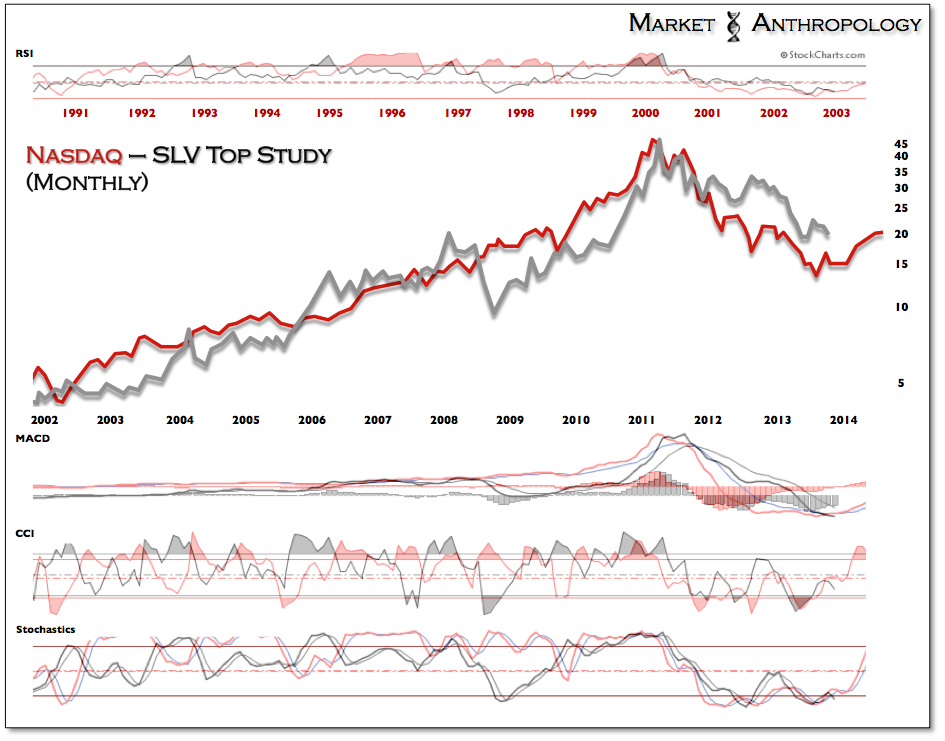
The ratio chart below for silver and gold was normalized by the momentum low prior to each parabolic build - rather than the asset highs of the comparison. Despite this, the concept of the asset cycle and prospective low stands very much the same. 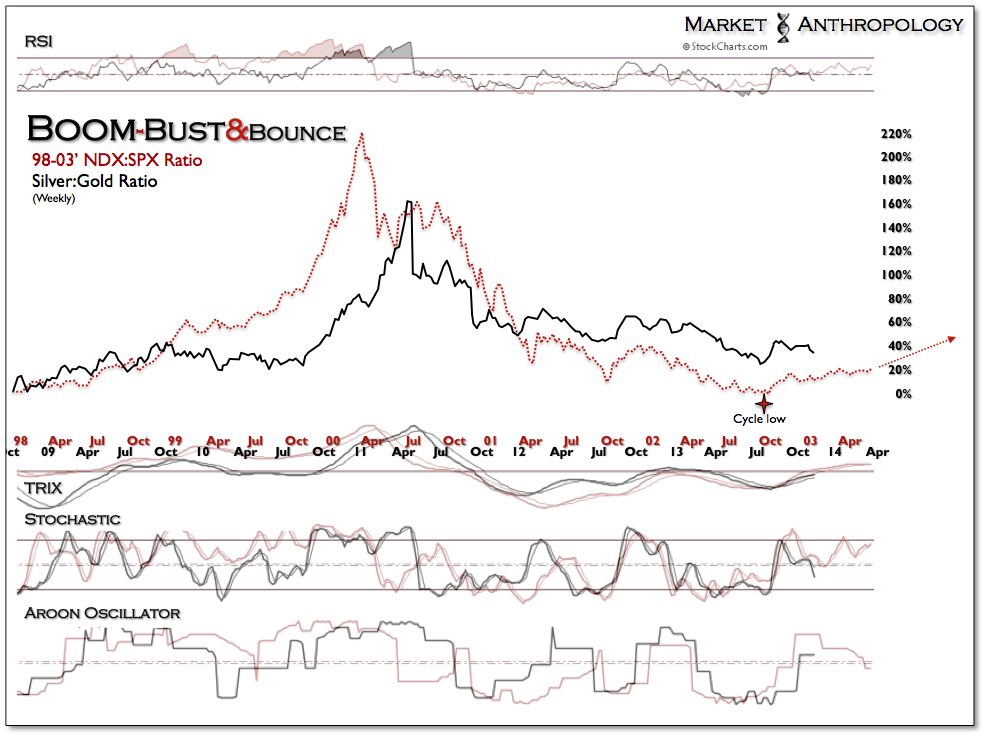
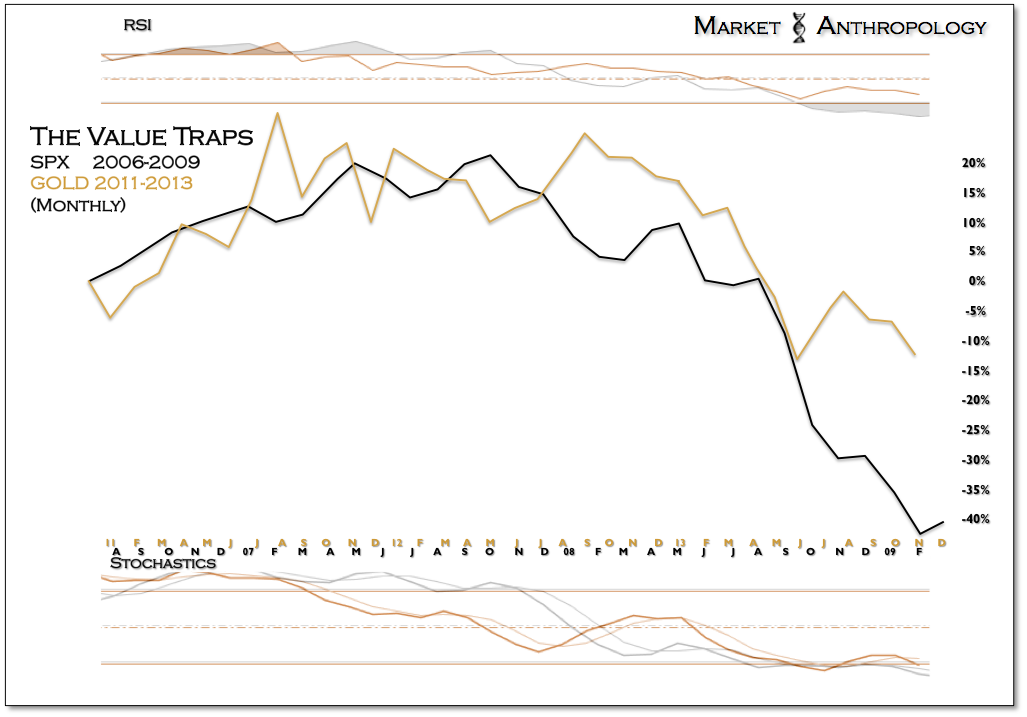
To help validate what we expect will be a major turning point for the sector, we thought we would also check back in on a longer-term performance comp we introduced last January between the value traps of the previous cycle (financials) and the miners today. Similar to the Nasdaq chart, the value-trap comparative pointed towards a cycle low for the miners this year - specifically in November.
And although the sector has audibled lower from our more acute comparative work with the banks in Q4 of 2011 (see Here), the timing for a prospective pivot higher now sits in the same seasonal window. Back in 2011, it was directly after the Thanksgiving break that the tax-loss selling for the beaten down asset class subsided and the banks started leading the broader equity market higher into 2012. 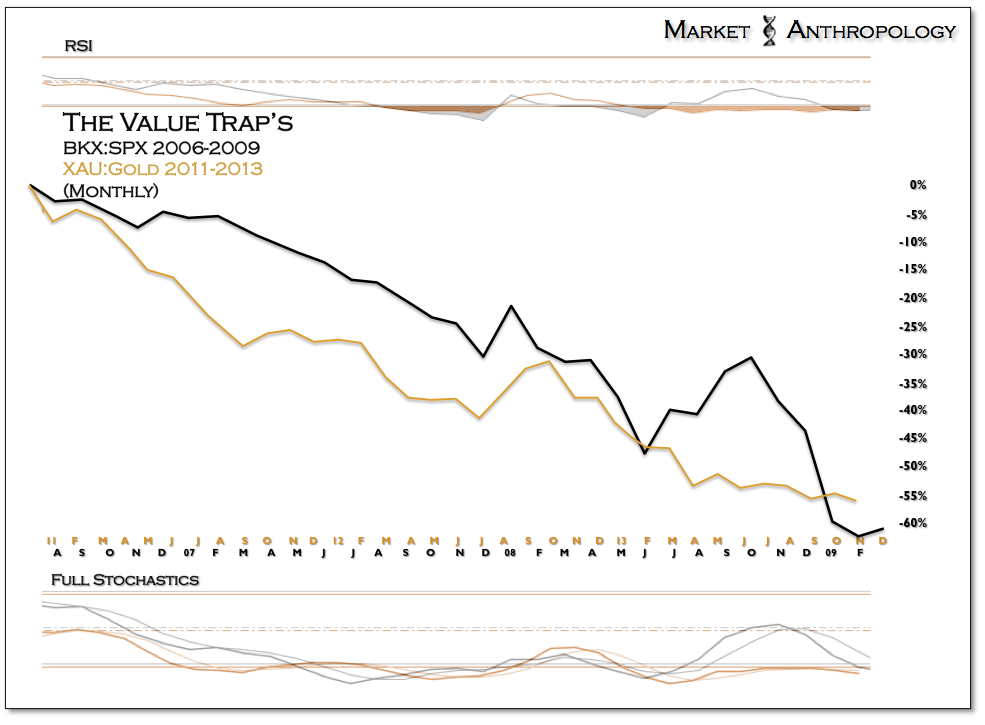
One of the more dangerous narratives that many participants continue to lean on is how quantitative easing influences precious metals, commodities and the dollar. During the explosive commodity led rally that was kicked off with Bernanke's August 27th 2010 Jackson Hole speech, additional stimulus by the Fed was seen as one of the leading motivating catalysts for taking part in an already crowded trade. The thesis that more stimulus equated with dollar debasement was momentarily reinforced by the correlation overlap of the currency markets as a major causative theme. Throw in a healthy dose of hysteria on the backside of the Financial Crisis and voila - the herd was galloping towards El Dorado. Of course we all know what happened only a few months after QE2 was enacted. The commodity markets cracked under their own weight, the dollar bottomed and El Dorado was found to be nothing more than a small Tex-Mex restaurant on the outskirts of Princeton...
With the resumption of QE3 in September of last year, the perceived benefit towards the asset class was short lived to say the least. While not surprising to us at the time (see Here) - gold, silver and the CRB all crested within days following the enactment of QE3. In the end, further stimulus was just more causative smokescreen for those wed to a poor investment idea. 
Today, as the precious metals and commodity sector continues to languish in the smoldering ruins of those hitched to this false narrative, we ask ourselves what likely will be the next upside catalyst for these assets. Does further easing provide such causative propellent and make much sense in the shadow of what transpired with QE2 and QE3? From our perspective the opposite appears more likely. The Fed's taper that many precious metals bulls fear and bears embrace will likely be the confirmation that reflation in world-wide growth, the key ingredient missing over the last two years - is the next chapter for the markets to chew on. With China and emerging markets now knocking on overhead resistance, we feel that the commodity sector expressed through its most emotional proxies of silver and gold, will once again begin leading the next reflationary leg higher.
- English (UK)
- English (India)
- English (Canada)
- English (Australia)
- English (South Africa)
- English (Philippines)
- English (Nigeria)
- Deutsch
- Español (España)
- Español (México)
- Français
- Italiano
- Nederlands
- Português (Portugal)
- Polski
- Português (Brasil)
- Русский
- Türkçe
- العربية
- Ελληνικά
- Svenska
- Suomi
- עברית
- 日本語
- 한국어
- 简体中文
- 繁體中文
- Bahasa Indonesia
- Bahasa Melayu
- ไทย
- Tiếng Việt
- हिंदी
A Closer Look At Gold And Silver
Published 11/28/2013, 12:18 AM
Updated 07/09/2023, 06:31 AM
A Closer Look At Gold And Silver
3rd party Ad. Not an offer or recommendation by Investing.com. See disclosure here or
remove ads
.
Latest comments
Install Our App
Risk Disclosure: Trading in financial instruments and/or cryptocurrencies involves high risks including the risk of losing some, or all, of your investment amount, and may not be suitable for all investors. Prices of cryptocurrencies are extremely volatile and may be affected by external factors such as financial, regulatory or political events. Trading on margin increases the financial risks.
Before deciding to trade in financial instrument or cryptocurrencies you should be fully informed of the risks and costs associated with trading the financial markets, carefully consider your investment objectives, level of experience, and risk appetite, and seek professional advice where needed.
Fusion Media would like to remind you that the data contained in this website is not necessarily real-time nor accurate. The data and prices on the website are not necessarily provided by any market or exchange, but may be provided by market makers, and so prices may not be accurate and may differ from the actual price at any given market, meaning prices are indicative and not appropriate for trading purposes. Fusion Media and any provider of the data contained in this website will not accept liability for any loss or damage as a result of your trading, or your reliance on the information contained within this website.
It is prohibited to use, store, reproduce, display, modify, transmit or distribute the data contained in this website without the explicit prior written permission of Fusion Media and/or the data provider. All intellectual property rights are reserved by the providers and/or the exchange providing the data contained in this website.
Fusion Media may be compensated by the advertisers that appear on the website, based on your interaction with the advertisements or advertisers.
© 2007-2024 - Fusion Media Limited. All Rights Reserved.