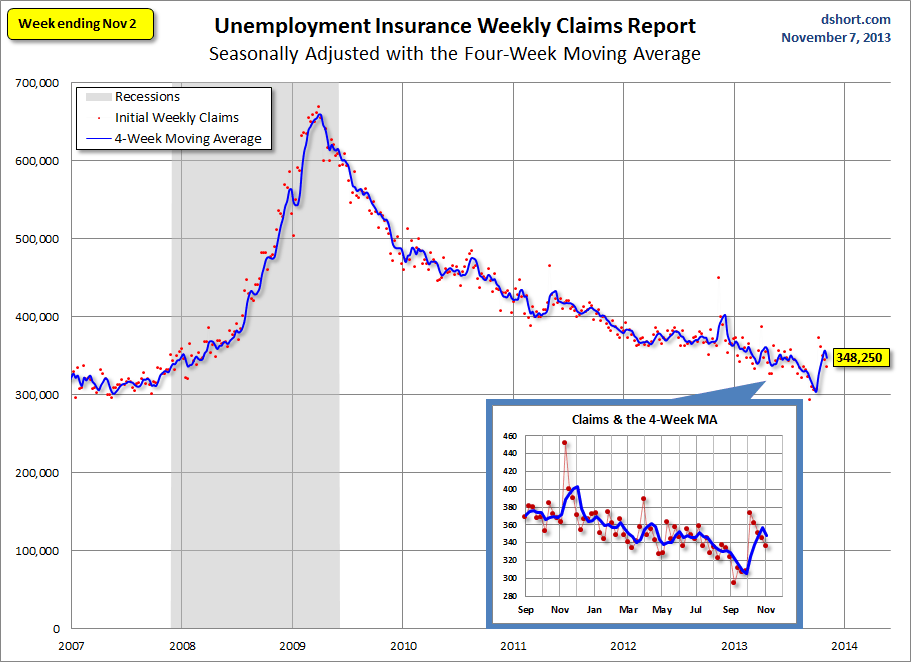
The Unemployment Insurance Weekly Claims Report was released this morning for last week. The 336,000 new claims number was a 9,000 decline from the previous week's 345,000 (an upward revision from 340,000). The less volatile and closely watched four-week moving average, which is usually a better indicator of the trend, declined by 9,250 to 348,250.
The financial press (e.g., Reuters) reports that decline in new claims was to some extent attributable to California resolving its computer glitches after a major upgrade a few weeks ago. In today's report California new claims dropped by 13,033.
Here is the opening of the official statement from the Department of Labor:
In the week ending November 2, the advance figure for seasonally adjusted initial claims was 336,000, a decrease of 9,000 from the previous week's revised figure of 345,000. The 4-week moving average was 348,250, a decrease of 9,250 from the previous week's revised average of 357,500.
The advance seasonally adjusted insured unemployment rate was 2.2 percent for the week ending October 26, unchanged from the prior week's unrevised rate. The advance number for seasonally adjusted insured unemployment during the week ending October 26 was 2,868,000, an increase of 4,000 from the preceding week's revised level of 2,864,000. The 4-week moving average was 2,866,000, a decrease of 8,500 from the preceding week's revised average of 2,874,500.
Today's seasonally adjusted number came in slightly above the Investing.com forecast of 335K.
Here is a close look at the data over the past few years (with a callout for the past year), which gives a clearer sense of the overall trend in relation to the last recession and the trend in recent weeks.
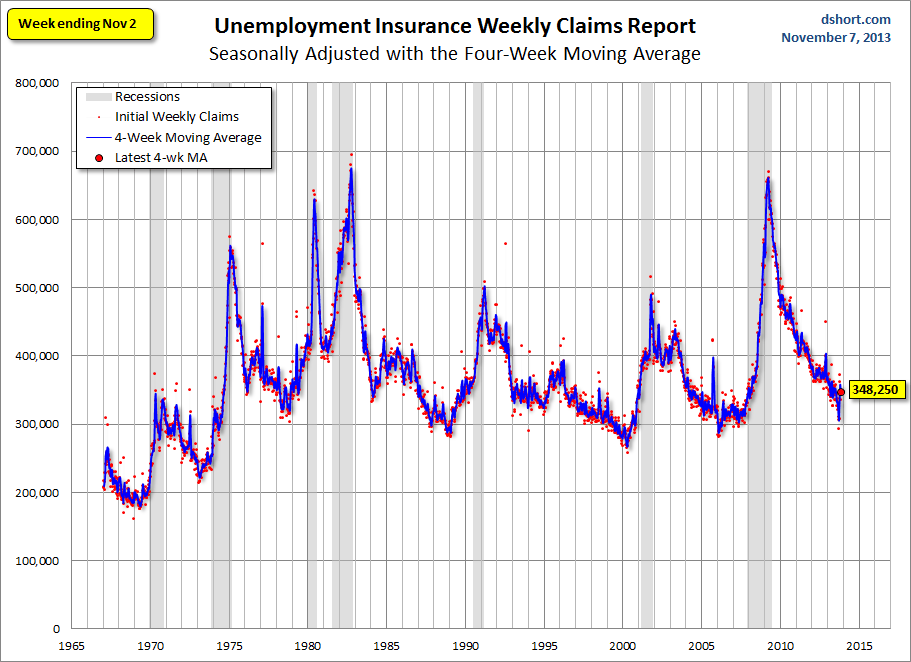
As we can see, there's a good bit of volatility in this indicator, which is why the 4-week moving average (the highlighted number) is a more useful number than the weekly data. Here is the complete data series.
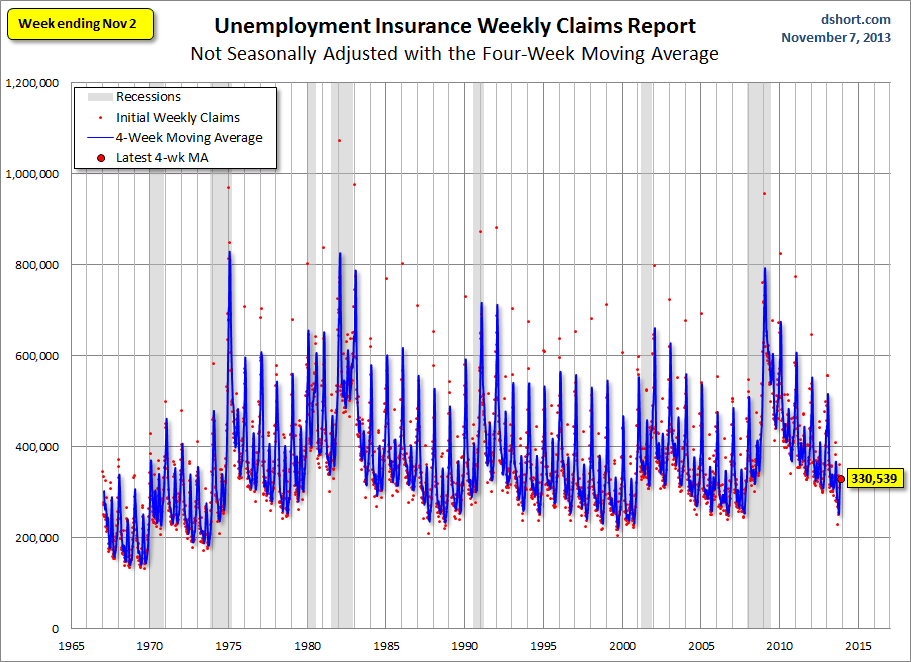
Occasionally I see articles critical of seasonal adjustment, especially when the non-adjusted number better suits the author's bias. But a comparison of these two charts clearly shows extreme volatility of the non-adjusted data, and the 4-week MA gives an indication of the recurring pattern of seasonal change in the second chart (note, for example, those regular January spikes).
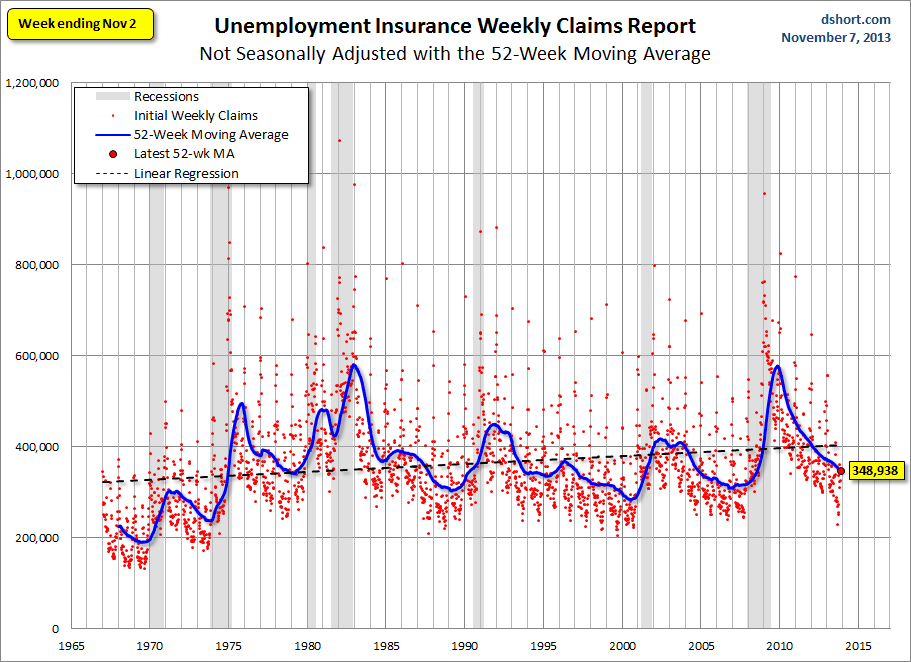
Because of the extreme volatility of the non-adjusted weekly data, a 52-week moving average gives a better sense of the secular trends. I've now added a linear regression through the data. We can see that this metric continued to fall below the long-term trend stretching back to 1968.
A Four-Year Comparison
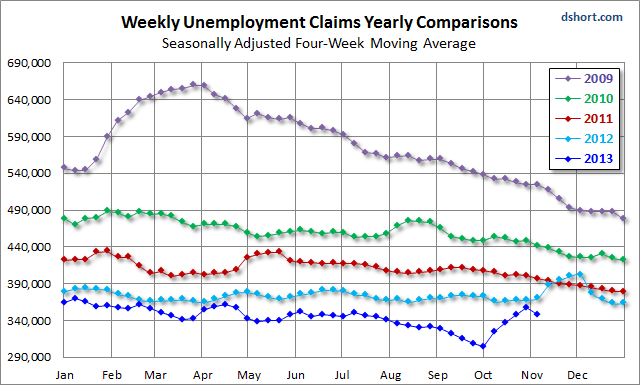
Here is an overlay of the past three calendar years and the beginning of 2013 using the 4-week moving average. The purpose is to show the relative annual slope of improvement since the peak in the spring of 2009. This year got off to an excellent start. It then oscillated a bit, stalled for about nine weeks and then headed lower from early July until October. After four reports in the wrong direction (largely resuting from computer upgrades in some states), the trend is on the mend.
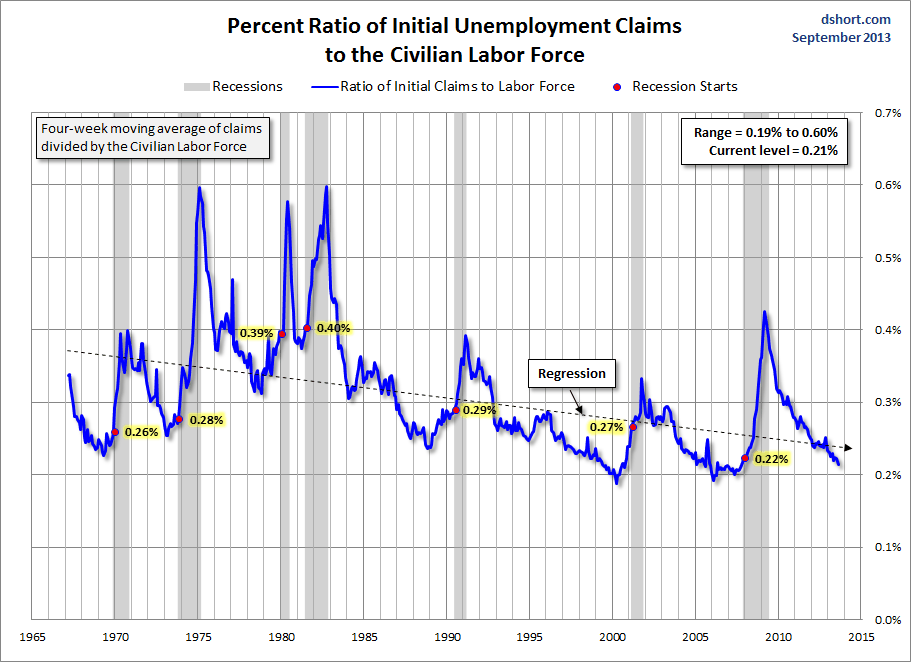
For an analysis of unemployment claims as a percent of the labor force, see my recent commentary What Do Weekly Unemployment Claims Tell us About Recession Risk? Here is a snapshot from that analysis.

