In only a few days Santa will make his way around the world and into billions of homes where he will leave presents for good little boys and girls. This is a festive time of year. Parties, lights everywhere. It is hard to not be excited. But will Santa find a surprise on this trip? A dead body? He might in the US Treasury market.
A young colleague, who announced he had gathered his first client, was making a case at a CMT Association event a couple of days ago for the utter and total collapse of the Bond market that would lead to a very deep depression. Clearly he is not excited about the season, but I digress. He was using Elliott Wave and volume techniques to tell me the same thing 30 year bond pros have been saying for over 2 years, that bonds would collapse. They have been totally wrong so my bias was to dismiss him.
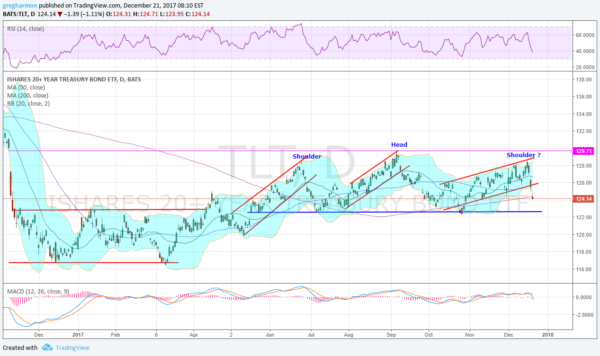
But instead I cleared my chart of my biases and took a fresh look. The chart above shows the result. I do not know about bond market annihilation or widespread depression. But I do see some troubling aspects in the near term. The chart shows the price action of the iShares 20+ Year Treasury Bond (NASDAQ:TLT) ETF since a gap down following the Presidential election. You can see it made a bottom in December 2016 and then moved sideways in a channel. it broke that channel, confirming a double bottom in April, but quickly faded.
After a higher low, it started higher again in May, peaking in June at a higher high, but short of the gap. It pulled back to the top of the prior channel, resistance now becoming support. The move up made a higher high, but still short of closing the gap, and then fell back to the same support. The third trip higher has been in a lower angle channel, not as aggressive buying. It also stopped shy of a gap fill and notably below the September high. The movement of the last few days has broken this rising channel and taken the price below the 200 day SMA for the second time since July.
The last three tops set up a potential Head and Shoulders Topping pattern, should the price break the neckline, that support area that has held since May. That would give a price objective lower to at least 115.45. That would be a new 29 month low. It would certainly bolster the young analysts case. Momentum is on the side of more downside as well. The neckline sits at a price of 122.60. And if triggered, the pattern does not fail until the price makes a new high over the right shoulder, so there is a wide path in terms of risk versus reward. I will be watching but not involved.
The information in this blog post represents my own opinions and does not contain a recommendation for any particular security or investment. I or my affiliates may hold positions or other interests in securities mentioned in the Blog, please see my Disclaimer page for my full disclaimer.