
: 62.9% (ends a 1-day overbought period
VIX Status: 14.5
General (Short-term) Trading Call: Sell more longs, initiate shorts if none on-hand.
Commentary
T2108 plunged 10.5%, dropping to levels last seen in December, 2012. Not only did this plunge end a brief 1-day overbought period, it officially seals the history of the 31-day overbought period that began 2013. My decision to choose the aggressive strategy of grabbing fresh SSO puts in the face of Tuesday’s rally has turned into a winner for now.
The S&P 500 dropped 1.2%, forming a bearish engulfing pattern. The VIX soared off 7-year lows with an 18.2% gain which put it right back under presumed resistance around 15, a level that has held all year.

The S&P 500 is now resting directly on top of the 20DMA that has loosely defined this year’s gradual yet persistent uptrend. I do not expect this support to fail right away, but if it does, it will all but confirm a correction is underway (and a top is in for now). The bearish engulfing pattern is all the more bearish coming directly on the heels of a 1-day overbought period that followed an extreme overbought period (consider that 1-day overbought period a fake-out).
Similarly, the VIX’s rise yesterday was awesome to behold, but it must break through the 15 level to signal that a “real” correction is likely underway.
Perhaps most telling of changes in the wind are the tremors subtly revealing themselves in the currency market. In particular, the euro (FXE) broke through its 50DMA with the 20DMA now in decline (EUR/USD). This combination suggests the euro has much lower to go from here (target the 200DMA).
The yen (FXY) has gone nowhere against the U.S. dollar (USD/JPY) for most of this month and is about to challenge the strong uptrend represented by the 20DMA. Against the pound and the euro, definitive corrections are underway with the 20DMA violated on EUR/JPY and the more important 50DMA violated on GBP/JPY.
Perhaps most importantly, enthusiasm for the Australian dollar (FXA) continues to wane (USD/AUD). For most of February, it has struggled against stiff overhead resistance at the 50 and 200DMAs. Yesterday, it plunged back to levels that closed out both 2010 and 2011.
Here are some charts…. 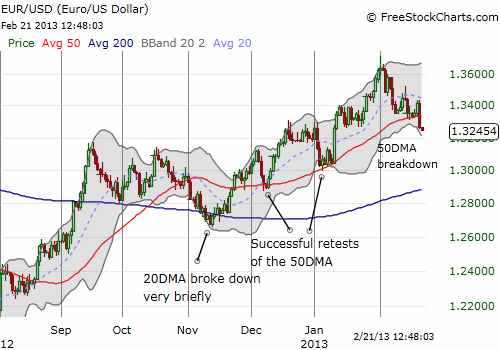 EUR/USD" title="EUR/USD" width="500" height="350">


In isolation, any one of these developments could represent warning flags. All combined, coming on the heels of an extreme overbought period, they tell me that a fundamental change is likely occurring. The winds of change seem to be swirling. I think it makes sense to at least brace myself with the SSO puts and to emphasize short opportunities over long ones for now.
For those who want to stick with the overall bullish trends (for example, the Black Friday trade I pointed out last November), buy only when (if?) the correction gets steep; my chart of the S&P 500 reminds you of my first downside target. Obviously, oversold conditions will get bought, but that is not on my radar right now.
Black line: T2108 (measured on the right); Green line: S&P 500 (for comparative purposes)
Red line: T2108 Overbought (70%); Blue line: T2108 Oversold (20%)
Be careful out there!
Disclosure: long VXX shares and puts, long SSO puts, net short British pound and the Australian dollar, long Japanese yen
- English (UK)
- English (India)
- English (Canada)
- English (Australia)
- English (South Africa)
- English (Philippines)
- English (Nigeria)
- Deutsch
- Español (España)
- Español (México)
- Français
- Italiano
- Nederlands
- Português (Portugal)
- Polski
- Português (Brasil)
- Русский
- Türkçe
- العربية
- Ελληνικά
- Svenska
- Suomi
- עברית
- 日本語
- 한국어
- 简体中文
- 繁體中文
- Bahasa Indonesia
- Bahasa Melayu
- ไทย
- Tiếng Việt
- हिंदी
A Change In The Wind Now Visible In Markets
Published 02/22/2013, 01:58 AM
Updated 07/09/2023, 06:31 AM
A Change In The Wind Now Visible In Markets
T2108 Status
Latest comments
Loading next article…
Install Our App
Risk Disclosure: Trading in financial instruments and/or cryptocurrencies involves high risks including the risk of losing some, or all, of your investment amount, and may not be suitable for all investors. Prices of cryptocurrencies are extremely volatile and may be affected by external factors such as financial, regulatory or political events. Trading on margin increases the financial risks.
Before deciding to trade in financial instrument or cryptocurrencies you should be fully informed of the risks and costs associated with trading the financial markets, carefully consider your investment objectives, level of experience, and risk appetite, and seek professional advice where needed.
Fusion Media would like to remind you that the data contained in this website is not necessarily real-time nor accurate. The data and prices on the website are not necessarily provided by any market or exchange, but may be provided by market makers, and so prices may not be accurate and may differ from the actual price at any given market, meaning prices are indicative and not appropriate for trading purposes. Fusion Media and any provider of the data contained in this website will not accept liability for any loss or damage as a result of your trading, or your reliance on the information contained within this website.
It is prohibited to use, store, reproduce, display, modify, transmit or distribute the data contained in this website without the explicit prior written permission of Fusion Media and/or the data provider. All intellectual property rights are reserved by the providers and/or the exchange providing the data contained in this website.
Fusion Media may be compensated by the advertisers that appear on the website, based on your interaction with the advertisements or advertisers.
© 2007-2024 - Fusion Media Limited. All Rights Reserved.