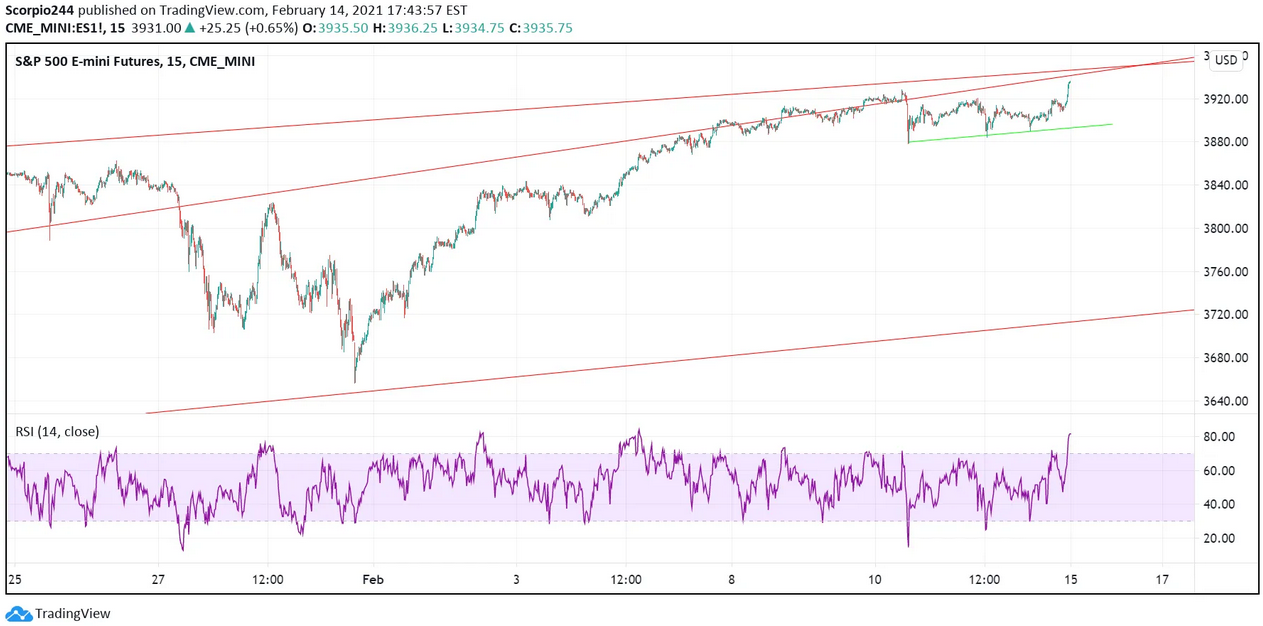
Stocks finished last week strongly, despite struggling around 3,900 all week. A massive $3 billion buy imbalance appeared in the final minutes Friday afternoon that sent the S&P 500 sharply higher to finish the day out up 65 bps to close at 3,931.
From a technical standpoint, there really isn’t much that changed for the S&P 500, with the upper level of resistance still on the trend line around 3,950. I still contend that we will likely see a drawdown back to the lower trend line around 3,800.
VIX
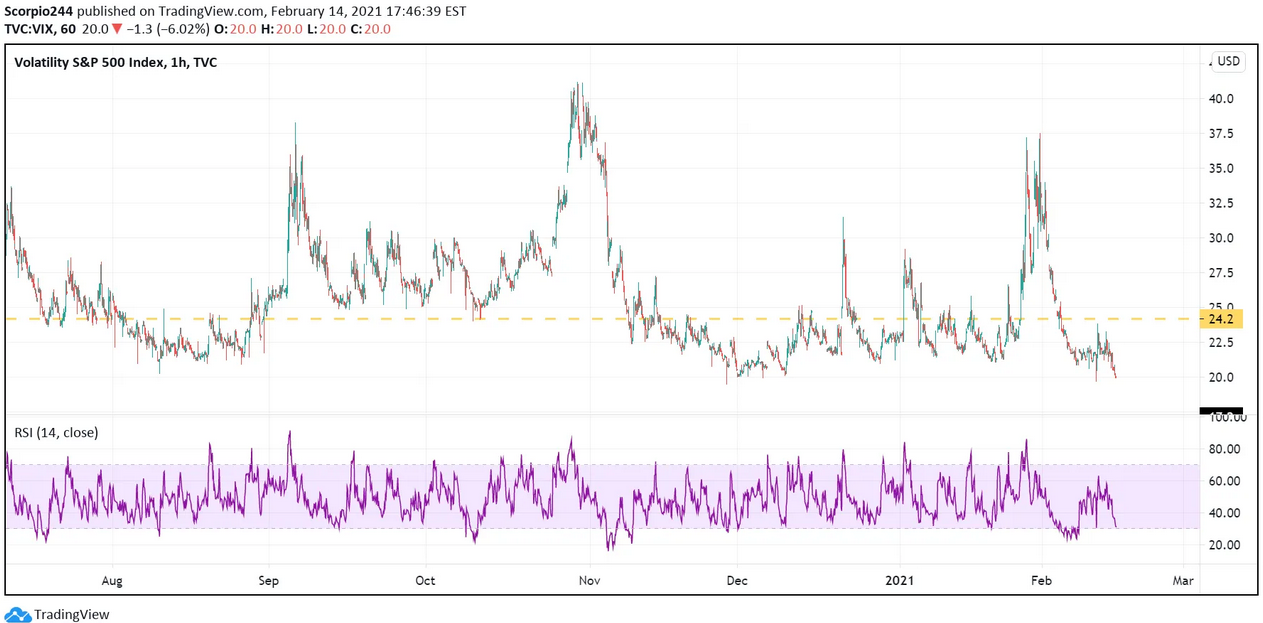
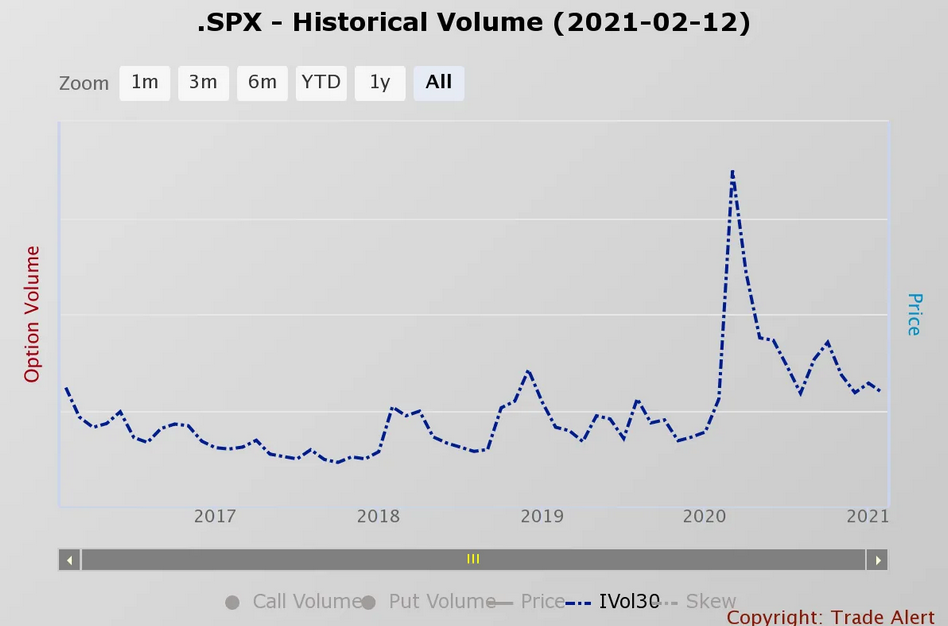
My view comes from the fact that I believe the VIX is at the bottom of the range at 20 to 22 and that we are more likely to see the VIX move higher than lower from this point, which is likely to pressure equity price down.
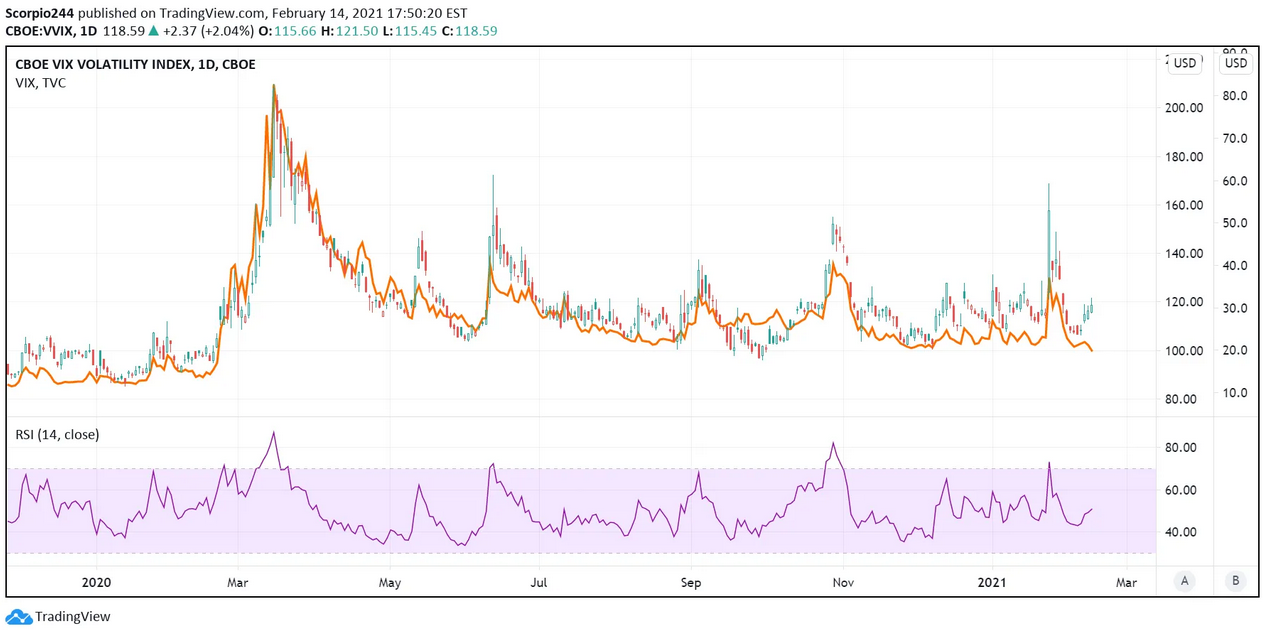
Oddly, despite the VIX dropping on Friday, the VVIX, which measures the implied volatility of the VIX, finished the day higher, a rare divergence.
Additionally, we haven’t seen the implied volatility levels in the overall market break to new lows yet. In fact, they remain well above the pre-pandemic levels.
VIX ETN
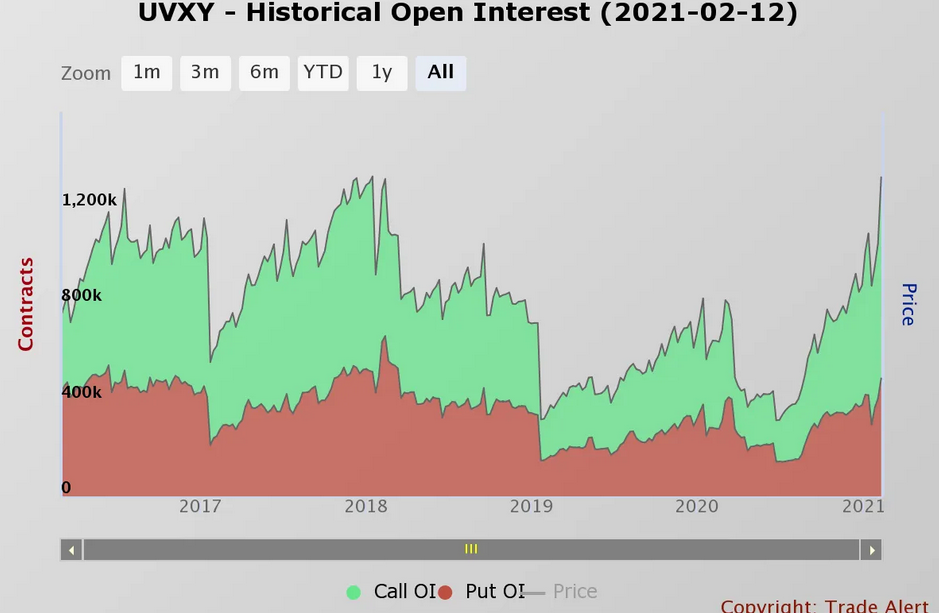
Some strange options positioning is occurring in the (NYSE:UVXY), a short-term VIX ETN. Open interest levels have risen to historic highs, specifically on the call side; this is notable and worth watching.
Apple
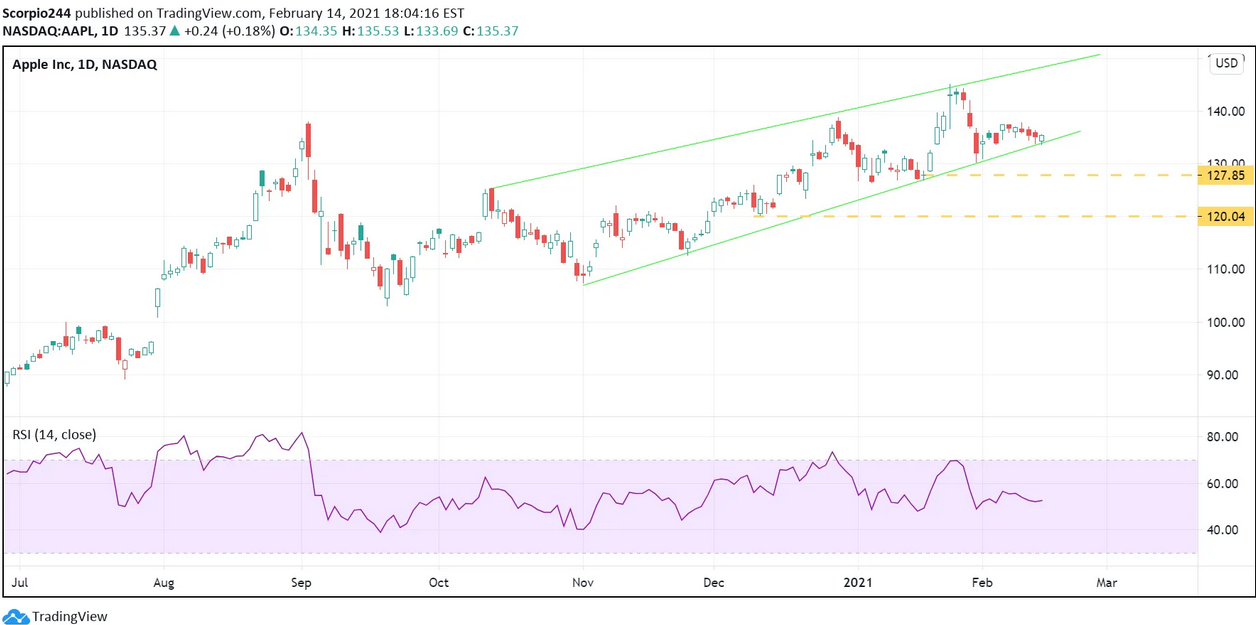
Apple (NASDAQ:AAPL) continues to be uneventful as the stock has been able to resume its upward movement despite robust quarterly results. The stock closed right on the uptrend, and I noted early this week there was a sizeable bearish bet placed in the options market against Apple. A break of the trend line around $133 likely triggers that decline with the next support level around $127.85, then $120.
Roku
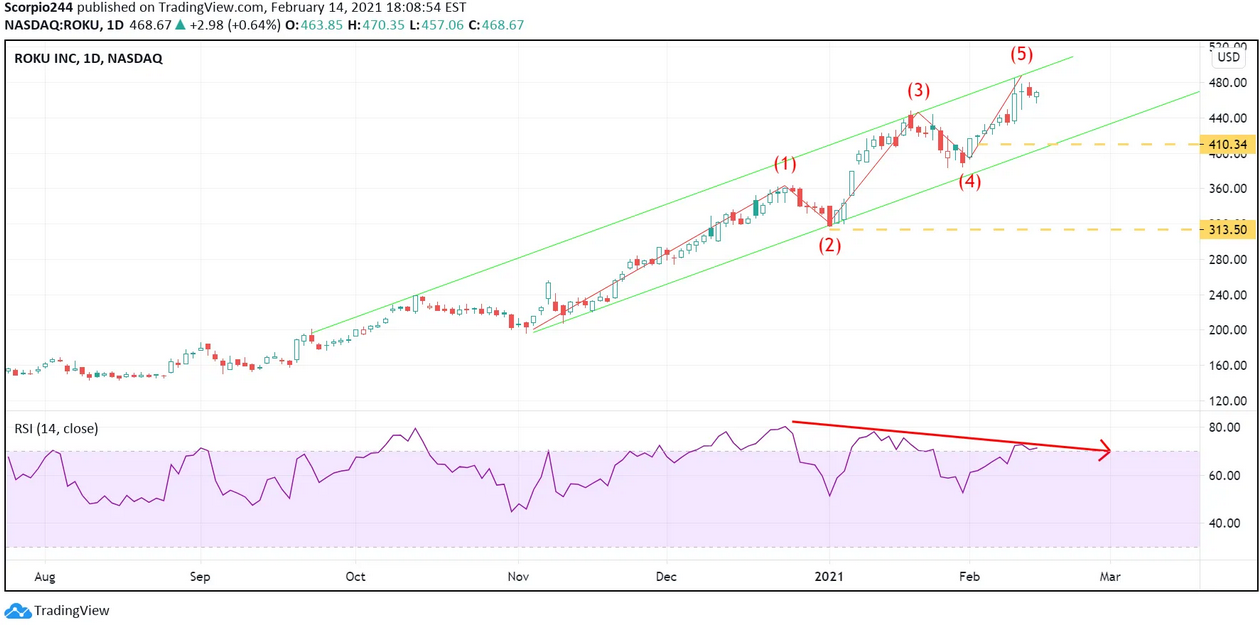
Roku (NASDAQ:Roku) will report results this week, and I think it has completed a 5 wave upcycle, indicating a drop back to the lower trendline at $420. Additionally, I noted, in my article, Roku’s Results May Fail To Live Up To Massive Expectations, that there was a bet that the stock falls in the weeks following results.
Zoom
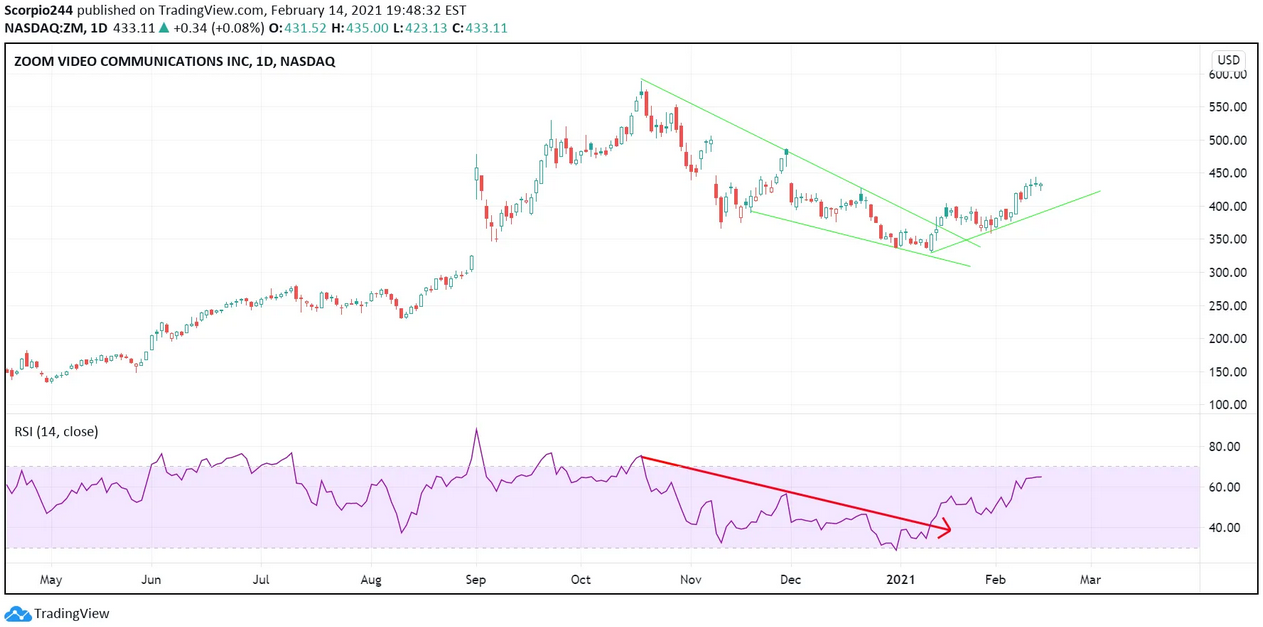
Zoom Video (NASDAQ:ZM) has been steadily climbing and is likely to refill the technical gap around $478.
Exxon
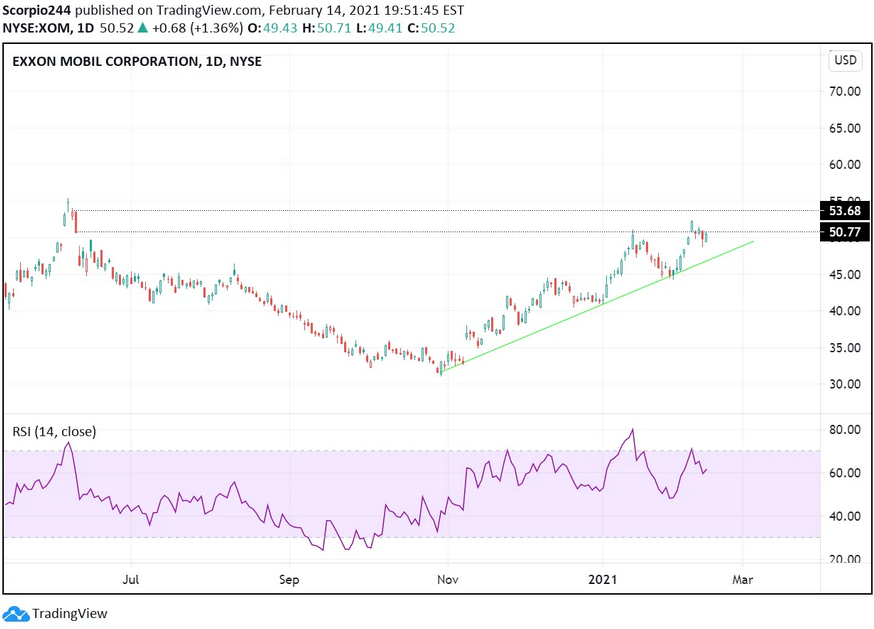
ExxonMobil (NYSE:XOM) is probably not finished rising either, especially with oil prices climbing. There is a healthy uptrend in the stock, and a push above $51 likely sends the stock higher towards $53.70.
Amazon
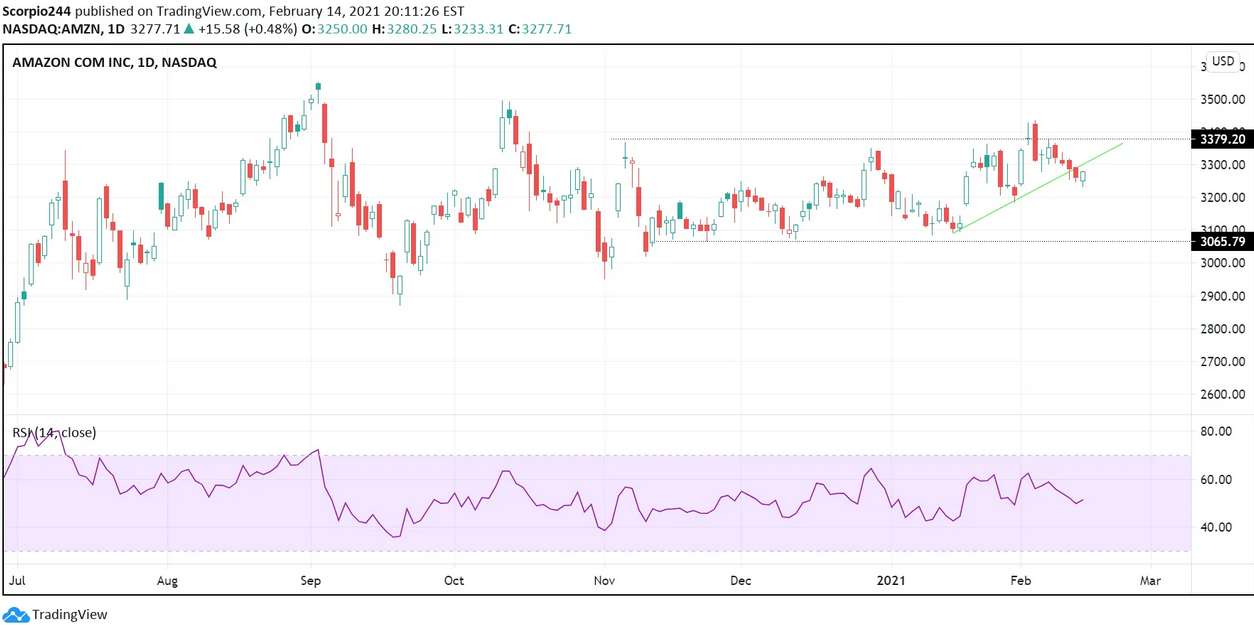
Amazon (NASDAQ:AMZN) has been trending towards the upper end of its trading range of 3,065 to 3,380. However, that trend now appears to have broken, and that could result in the stock heading back to the side of the range at 3,065.
