Other than permanently bearish writers and investors, few address the possibility of the U.S. falling into a recession. Many conclude that the Federal Reserve’s ultra-low rate policy completely altered the landscape such that the idea of a business cycle no longer exists. Others merely ignore warning signs until, unfortunately for them, the opportunity to reduce investment risk has passed them by.
Until recently, I have only discussed the possibility of a recession in the context of a Fed policy mistake. (Thank you, Captain Obvious.) Indeed, I have addressed the pervasive concern that the central bank might raise rates too quickly and/or too frequently, hampering U.S. economic growth that has relied upon stimulus for six-plus years.
However, a social media participant reminded me of an article that I wrote back in December 2007. In my feature, I shared my personal predictive model for determining the probability of economic contraction. In December 2007, my model placed the recession likelihood at 70%. It moved up to 80% in January of 2008 in an article published by Investors’ Business Daily. Unfortunately for folks who relied on less robust indicators (or none at all), the National Bureau of Economic Research (NBER) did not identify that a recession had begun in October of 2007 until October of 2008 – one year later. By that time, the U.S. stock market had already been crippled by the 2008 stock bear.
There are five forecasting tools that I have traditionally favored for identifying the probability of a cyclical downturn. For simplicity sake, I weight the components equally to come up with a “probability picture.”
Here, then, is my predictive model as it stands in March of 2015:
1. The Institute For Supply Management’s Report on Business. One of the most popular measures of business expansion or contraction is the Purchasing Managers’ Index (PMI). In the broadest sense, a percentage over 50 is indicative of manufacturer health; February PMI came in at 52.9. However, since the Fed backed off of its quantitative easing (QE) in October, the trend has been toward slower and slower growth. PMI percentages came in at 57.9 in October, 57.6 in November, 55.1 in December, 53.5 in January and now 52.9 in February, the slowest growth in 13 months.
With my model considering the trend as well as the static data point, I split the difference; that is, I am awarding 10 percentage points to the “no recession camp” for the actual data point indicating expansion. On the flip side, the dangerous trend that has emerged alongside “de facto” tightening by the Fed also merits 10 points.
2. Conference Board’s Consumer Data. The “Present Situation” Index decreased to 110.2 from 113.9, while the “Future Expectations” Index declined to 87.2 from 97.0 in January. My model evaluates whether or not future expectations are falling faster (if they’re falling at all). If it is falling at a faster month-over-month clip than the present situation measure, it may be indicative of an economy succumbing to recessionary pressures. And indeed, this is the case. The Present Situation Index decreased to 110.2 from 113.9, declining at a rate of 3.2% whereas the Future Expectations Index slipped to 87.2 from 97.0, an accelerated pace of 10.1%. My model awards 20 points to the likelihood of a recession’s occurrence.
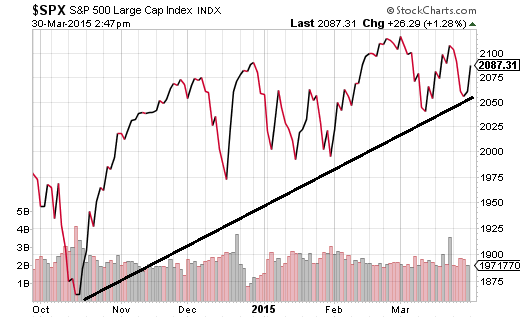
3. The S&P 500 Making Lower Lows. This one is not happening at all. In fact since, the October lows, the S&P has marked a series of higher lows in December, January and March. I award 20 to the resilient economy scenario.

4. Corporate 10-Year’s Widen Against 10-Year Treasuries. My model looks at spreads in six month intervals. Six months earlier, the Composite Corporate Bond Rate (CCBR) was at 4.32% and the 10-year Treasury was a 2.4%. Today, the spread is identical, with the CCBR at 3.87% and the 10-year treasury at 1.95%. (That’s 20 more for the “no-recession” folks.)
5. 3-Month Treasury Versus 10-Year Treasury. History suggests that one should be compensated by 2.5% or more for when taking the risk of investing in the longer-term 10-year Treasury note over a 3-month Treasury. If the spread is less than 2.5%, the risk of recession rises (a la flattening of the yield curve). Today’s 3-month offers 0.2%, while today’s 10-year offers about 1.95%… a difference of only 1.93%. That’s 20 percentage points for the recession gloom.
So what does the scoreboard say? It places the odds at 50-50. There’s a 50% chance that we will experience a recession in 2015 and 50% chance that we will avoid it.
The manufacturing slowdown, the rapid deceleration of expectations by consumers and the flattening of the yield curve are troubling. In contrast, the actual manufacturing data point, the U.S.stock market trends and the stable spread between corporate bonds and comparable treasuries are reassuring.
Is there anything an investor should be doing differently, then? That depends. If you’ve been relying too heavily on stock price appreciation, you’d be wise to ratchet back on extreme aggressiveness. Perhaps shift a portion of your stock allocation to foreign stock “faves” such as iShares Currency Hedged Germany (HEWG) or iShares Europe Minimum Volatility (EFAV). Similarly, a 70 stock/30 non-stock might want to take the growth down to 60%, 55% or 50%, simultaneously adding to non-stock assets.
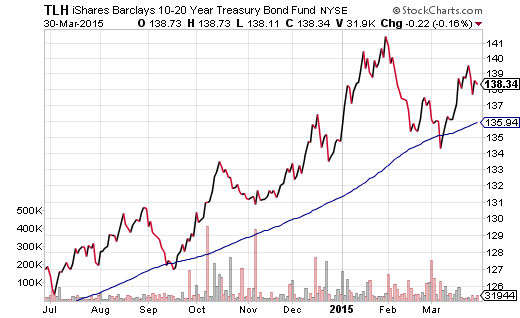
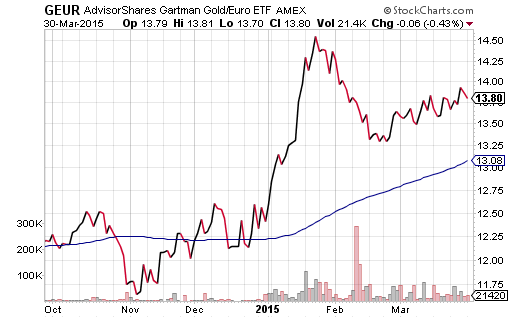
More importantly, if you’ve misjudged the benefits of non-stock assets, you may want to raise your allocation to the assets best suited for the possibility of a recession-based stock bear. One might look at the uptrend in longer-term U.S. Treasuries via funds like iShares 10-20 Year Treasury (TLH). One might even be intrigued by currency proxies like WisdomTree Dollar Bullish (USDU) or even AdvisorShares Gartman Gold/Euro ETF (GEUR).


To be frank, a 50% recession possibility is worrisome. Granted, the Fed could step in with more stimulus before the year is out, though it may be difficult to do after all the hype about its plans to raise its target rate several times in 2015. Similarly, the U.S. economy may prove more robust than I believe it is, where the yield curve steepens rather than continues to flatten.
Nevertheless, the prudent approach combines non-stock assets that are trending higher – iShares Lehman 10-20 Y Tr. Bond (NYSE:TLH), USDU, GEUR – with stock assets that are trending higher. In the same vein, one can apply a multi-asset stock hedge approach in an environment where asset volatility and economic uncertainty are elevated. My approach to multi-asset stock hedging? Tracking the FTSE Custom Multi-Asset Stock Hedge Index (MASH) offers an unleveraged alternative to conventional methods such as shorting, using inverse ETFs, going to cash or using put options in margin accounts.
Disclosure: Gary Gordon, MS, CFP is the president of Pacific Park Financial, Inc., a Registered Investment Adviser with the SEC. Gary Gordon, Pacific Park Financial, Inc, and/or its clients may hold positions in the ETFs, mutual funds, and/or any investment asset mentioned above. The commentary does not constitute individualized investment advice. The opinions offered herein are not personalized recommendations to buy, sell or hold securities. At times, issuers of exchange-traded products compensate Pacific Park Financial, Inc. or its subsidiaries for advertising at the ETF Expert web site. ETF Expert content is created independently of any advertising relationships.
