The major market index ETFs have had a great start to the week. Four days of a reversal back higher has many calling the bottom in place and a run higher coming. But the close Thursday has also brought in some doubters and this is reasonable too.
It all comes down to how you interpret the last 4 days' Candlesticks. There are many similarities in the charts elsewhere. The Relative Strength Index (RSI) is turning back higher. The Moving Average Convergence Divergence indicator (MACD) is leveling or starting to improve. These are positives. But the move higher has come on flat or declining volume and is only now nearing the gap lower in the bodies of the candles. So that leaves the Candlesticks, and there are two different views. Lets walk through those Candlesticks one by one to see what you think.
First, for the bulls, the Russell 2000 ETF, (IWM), below. The first candlestick, a Spinning Top out side of the Bollinger bands is a good reversal candidate. The second a near doji back inside the Bollinger® bands is is suspect, but does confirm the reversal in the Spinning Top. It is the next two Candlesticks, increasing in the size of their real bodies and moving up through the 20 day Simple Moving Average (SMA) that makes the bull case. These negate any doubt of the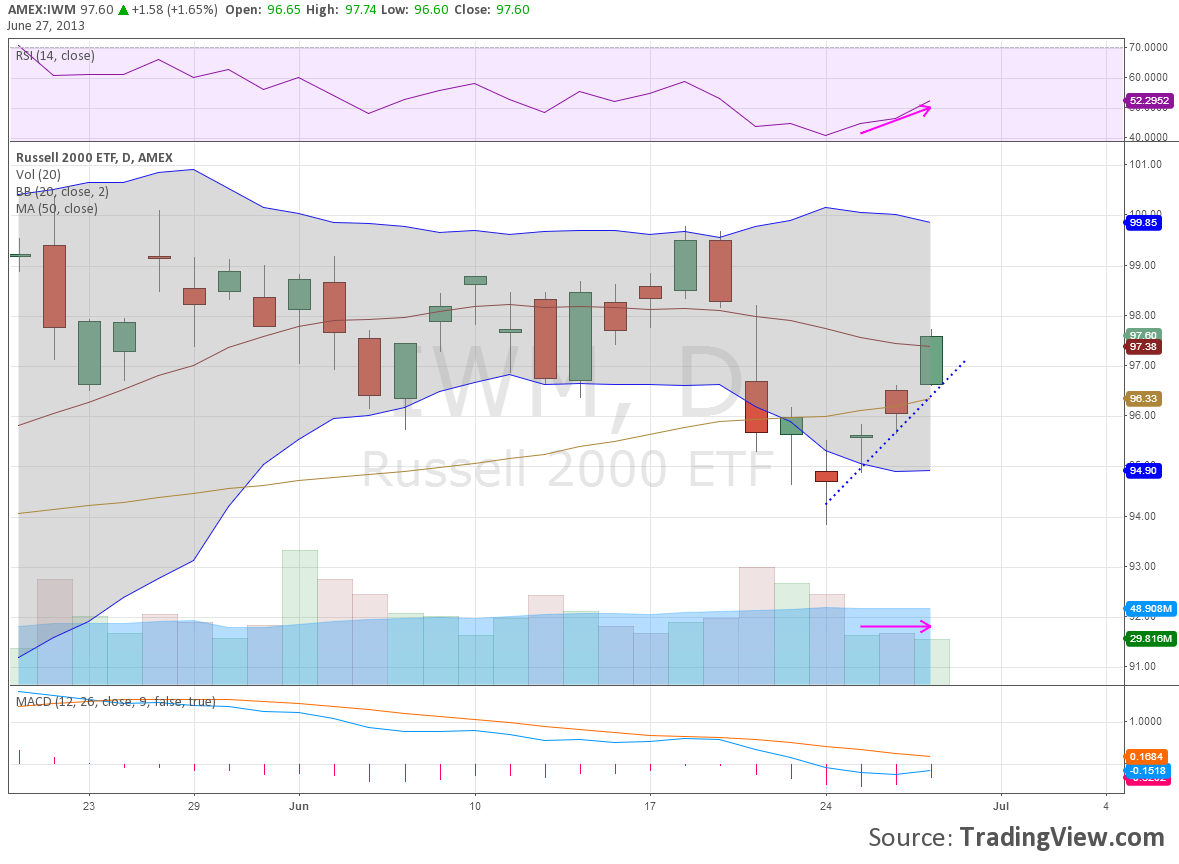
Spinning Top and the doji. With the characteristics mentioned above this builds a bullish mosiac. The Dow 30 ETF, (DIA) is pretty close to looking like this as well. Some may interpret this as a 3 Advancing White Soldiers pattern (the color on the second candle is wrong – it should be a solid black candle), which is very bullish. That may be a stretch but certainly all is well and you can lean back in your chair again. Until you look at the Nasdaq 100 ETF, (QQQ). This is a very different story, and by the way the same one the S&P 500 ETF, (SPY), is telling. It starts the same with the Spinning Top and confirmation higher with a candle back in the Bollinger bands. But then the doji’s continue and end Thursday with a 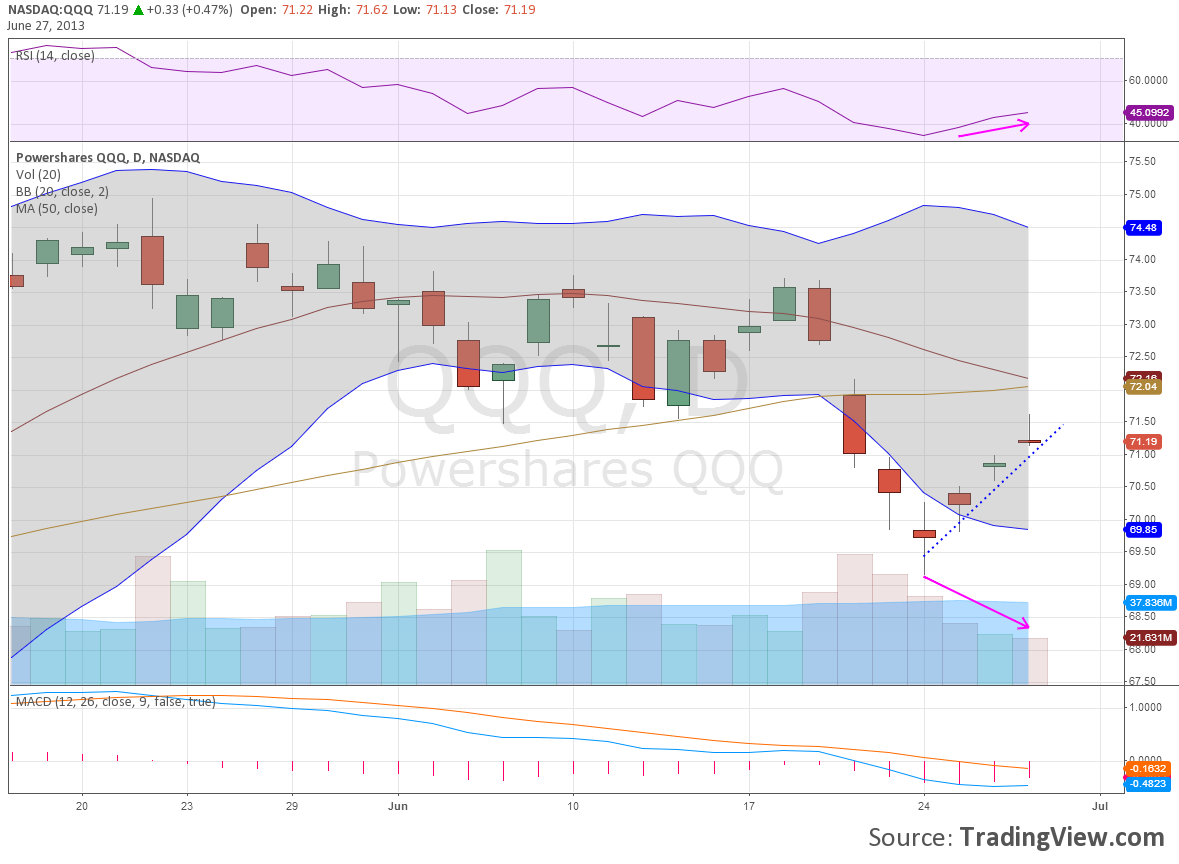
Gravestone Doji, or Shooting Star doji. This needs to be confirmed to be a reversal candle, but where is the long green body of the IWM candle? Where is the strong bullishness? This grouping with the gapping is more like an Advance Block, a weakening version of 3 Advancing White Soldiers. And this has not even made it to the 20 and 50 day SMA’s yet. So which set of candles is going to lead the market through the last day of the second Quarter?
Disclosure: The information in this blog post represents my own opinions and does not contain a recommendation for any particular security or investment. I or my affiliates may hold positions or other interests in securities mentioned in the Blog, please see my Disclaimer page for my full disclaimer.
Original post
- English (UK)
- English (India)
- English (Canada)
- English (Australia)
- English (South Africa)
- English (Philippines)
- English (Nigeria)
- Deutsch
- Español (España)
- Español (México)
- Français
- Italiano
- Nederlands
- Português (Portugal)
- Polski
- Português (Brasil)
- Русский
- Türkçe
- العربية
- Ελληνικά
- Svenska
- Suomi
- עברית
- 日本語
- 한국어
- 简体中文
- 繁體中文
- Bahasa Indonesia
- Bahasa Melayu
- ไทย
- Tiếng Việt
- हिंदी
4 Candles Create Market Confusion
Published 06/28/2013, 08:29 AM
Updated 05/14/2017, 06:45 AM
4 Candles Create Market Confusion
Latest comments
Loading next article…
Install Our App
Risk Disclosure: Trading in financial instruments and/or cryptocurrencies involves high risks including the risk of losing some, or all, of your investment amount, and may not be suitable for all investors. Prices of cryptocurrencies are extremely volatile and may be affected by external factors such as financial, regulatory or political events. Trading on margin increases the financial risks.
Before deciding to trade in financial instrument or cryptocurrencies you should be fully informed of the risks and costs associated with trading the financial markets, carefully consider your investment objectives, level of experience, and risk appetite, and seek professional advice where needed.
Fusion Media would like to remind you that the data contained in this website is not necessarily real-time nor accurate. The data and prices on the website are not necessarily provided by any market or exchange, but may be provided by market makers, and so prices may not be accurate and may differ from the actual price at any given market, meaning prices are indicative and not appropriate for trading purposes. Fusion Media and any provider of the data contained in this website will not accept liability for any loss or damage as a result of your trading, or your reliance on the information contained within this website.
It is prohibited to use, store, reproduce, display, modify, transmit or distribute the data contained in this website without the explicit prior written permission of Fusion Media and/or the data provider. All intellectual property rights are reserved by the providers and/or the exchange providing the data contained in this website.
Fusion Media may be compensated by the advertisers that appear on the website, based on your interaction with the advertisements or advertisers.
© 2007-2024 - Fusion Media Limited. All Rights Reserved.