Incoming legislation could have a negative impact on the Canadian utilities stocks on our list
SmallCapPower | June 20, 2018: A carbon tax bill has passed the House of Commons and Senate in Canada, which would subject provinces that do not implement a higher carbon tax or cap-and-trade system to a $20/t carbon tax in 2019, increasing to $50/t in 2022. Although Saskatchewan and the incoming Ontario governments plan to challenge the bill, legal scholars say it is unlikely that they will succeed. While the effects on consumer prices are unclear, any rate increases could drive consumers to alternative energy sources. The Canadian utilities stocks we’ve identified today rely on natural gas for significant portions of their income and could see significant declines depending on the legislative impact.

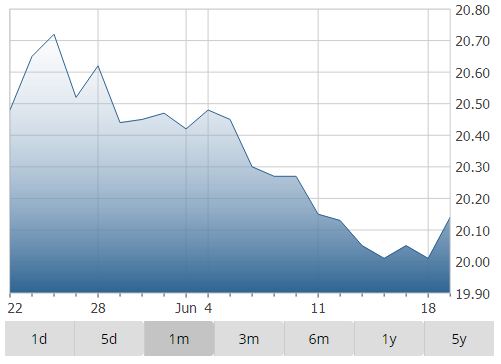
Valener Inc. (TO:VNR) – $20.01
Natural Gas Utilities
Valener owns 29% of Énergir, LP, a distributor of natural gas in Québec and Vermont. Énergir also sells electricity in Vermont and operates a gross 10MW of solar power. In addition, Valener owns 24.5% of SDB Wind Farms, responsible for 18.4% of the company’s consolidated bottom-line.
- Market Cap: $782.4M
- 3 Month Total Return: -1.5%
- YTD Total Return: -10.6%
- Enterprise Value to EBITDA FY2017: N/A
- Enterprise Value to EBITDA FY2018: 10.5x


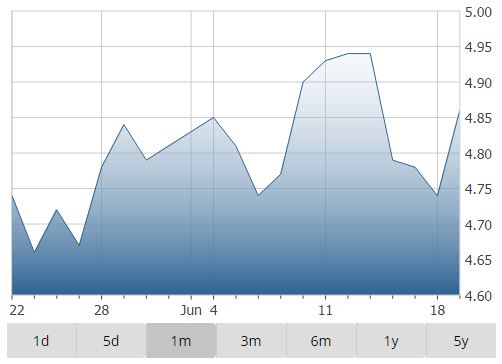
Just Energy Group Inc. (TO:JE) – $4.74
Natural Gas Utilities
Just Energy Group is a utility company operating in Canada and internationally. The company serves over 1.6M customers, of which 56% are commercial and 44% residential. It offers a suite of electricity and natural gas products, as well as providing energy management and sustainability solutions. The company has launched expansions into Japan, Ireland, and Germany since December 2016, bringing its total presence to 23 markets.
- Market Cap: $703.2M
- 3 Month Total Return: -20.7%
- YTD Total Return: -8.1%
- Enterprise Value to EBITDA FY2017: 6.9x
- Enterprise Value to EBITDA FY2018: 4.8x


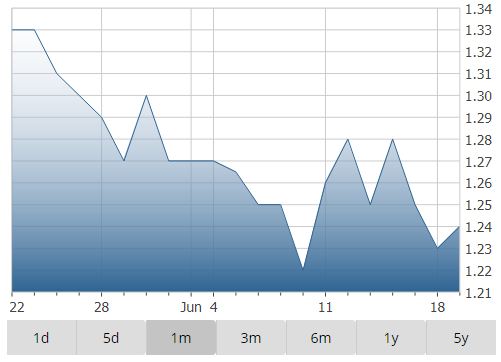
Tidewater Midstream and Infrastructure Ltd (TO:TWM) – $1.23
Natural Gas Utilities
Tidewater Midstream is a Canada-based natural gas company operating in Alberta. The company operates over 4,000 km of pipelines, transporting over 1.5 Bcf/day. More than 75% of its earnings is sourced from long-term relationships with over 50 customers, including TransAlta (TO:TA).
- Market Cap: $414.4M
- 3 Month Total Return: -8.9%
- YTD Total Return: -18.5%
- Enterprise Value to EBITDA FY2017: 11.0x
- Enterprise Value to EBITDA FY2018: 7.4x


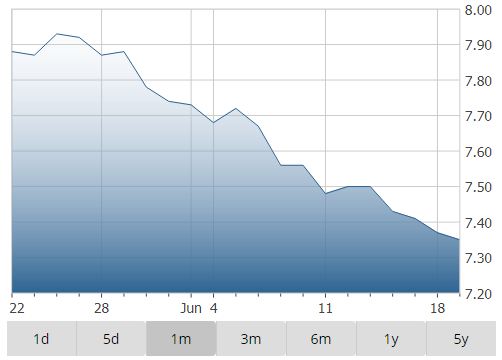
Crius Energy Trust (TO:KWH_u) – $7.37
Electric Utilities
Crius Energy provides electricity, natural gas and solar products to residential and commercial customers in North America and Australia. The company operates through nine subsidiaries, which serve more than 1M customers.
- Market Cap: $420.3M
- 3 Month Total Return: 0.9%
- YTD Total Return: -15.3%
- Enterprise Value to EBITDA FY2017: N/A
- Enterprise Value to EBITDA FY2018: 3.4x

Disclosure: Neither the author nor his family own shares in any of the companies mentioned above.
