One of the most recent mantras in the financial media is that housing prices rise because there is an inventory shortage. While it is an excellent headline for “getting clicks,” the are 3-reasons why there really is NO housing shortage.
A Quick Story
In 2007, as the housing market was going crazy, I lived in a quiet, gated community. I had no intention of selling my house. However, one day, a knock came at my door from a realtor who had a client willing to pay me much more than I ever imagined for the house.
I sold the next day.
Then, In October of 2008, I bought a house from a distressed seller relocated back to England. It was the “perfect” house, next to a prime school my kids could walk to, and extremely convenient to everything. It was my “forever” house.
In 2015, I received a knock at my door from a realtor representing a client moving from Montana to work for an oil and gas company. I guess he was “The Godfather” because he “made me an offer I could not refuse.”
I sold the next day.
The moral of the story is that “supply” is only a function of “price.” My homes were never “part” of the calculated inventory because they were never listed. However, they did become part of the “supply” when the “demand” fostered the right price.
Everyone will sell at a certain price. Supply is never a problem as long as prices rise and mortgage rates are accommodative.
However, therein lies “the rest of the story.”
The Myth Of A Supply Problem
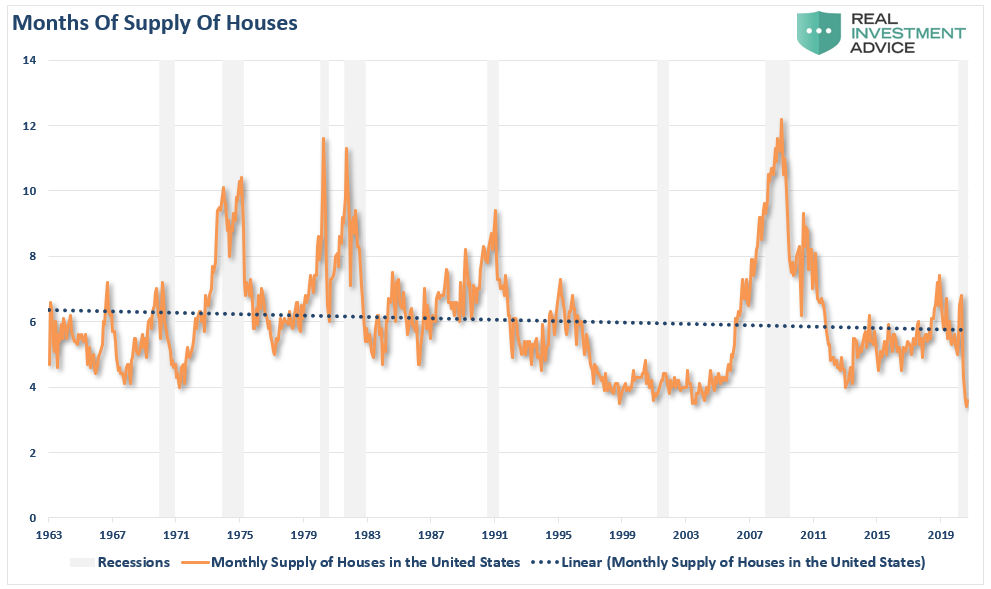
The “inventory shortage” argument comes from the following chart: the “months of supply” of homes. At just 3-months of supply, you can understand why the media believes there is a shortage. However, that is NOT what the chart is detailing.
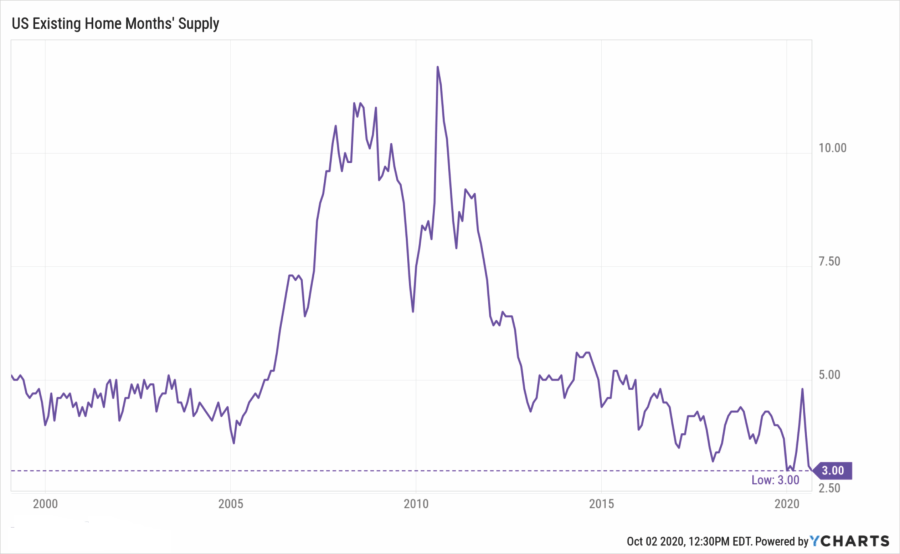
The chart only tells us that if NO more homes come to market at the current transaction rate, all homes currently for sale will get sold in 3-months. Such also assumes the current demand for homes remains the same.
Now, take a look at 2005.
The same “housing shortage” story existed then. Almost overnight, the real estate market went from a shortage of inventory to excess.
Were a massive number of homes built almost overnight? Of course not.
So what happened?
At The Margin
The problem with the mainstream analysis is the inability to interpret data correctly. When it comes to data based on the housing market’s transactional side, it only represents what is happening at the “margin” of the entire housing market. The economic importance of housing is more than just the relatively few individuals compared to the total population, who are actively seeking to buy, rent, or sell a home each month.
Let’s go back to that earlier question of what happened in 2005?
There are three primary issues which lead to changes in the supply of housing:
- Prices rise to the point that sellers come into the market.
- Interest rates rise, pulling buyers out of the market.
- An economic recession which removes buyers due to job loss.
When any of those things occur, transactions slow down, and “inventory” rises sharply.
Price Increases For Some, Not Most
Let’s start with housing prices.
The chart below is the composite index of the NAR and Corelogic (NYSE:CLGX) home prices over time.
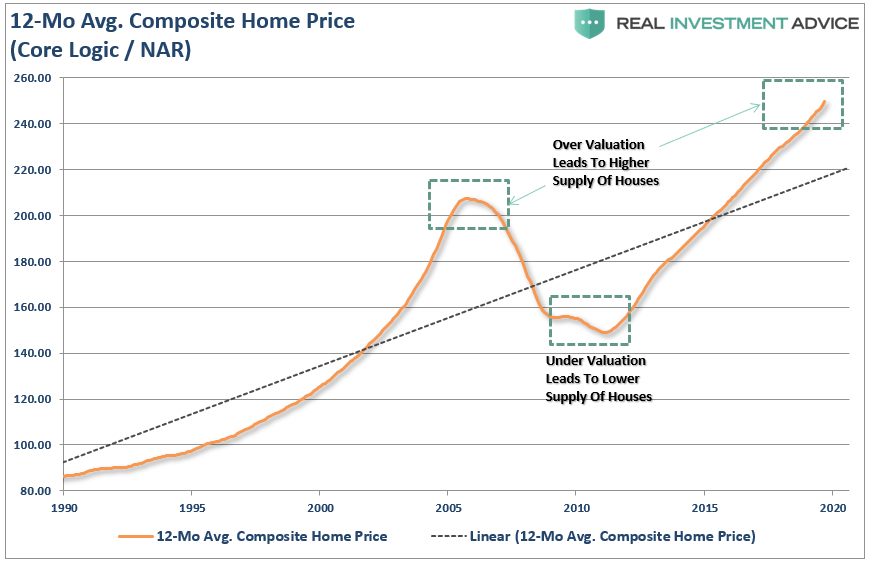
As stated, when prices of homes become inflated, individuals who weren’t previously considering selling will list their homes.
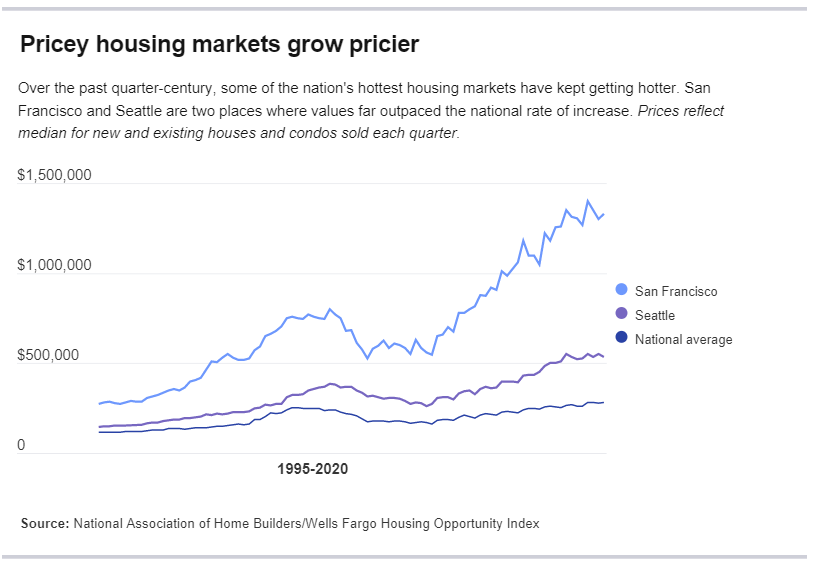
Yes, elevated prices exist but only in a small fraction of the country. While there is undoubtedly a “shortage of inventory” in those few markets, prices increases nationally are a far different story, as shown below.
When we look at the median and average home prices nationally, a very different picture emerges.
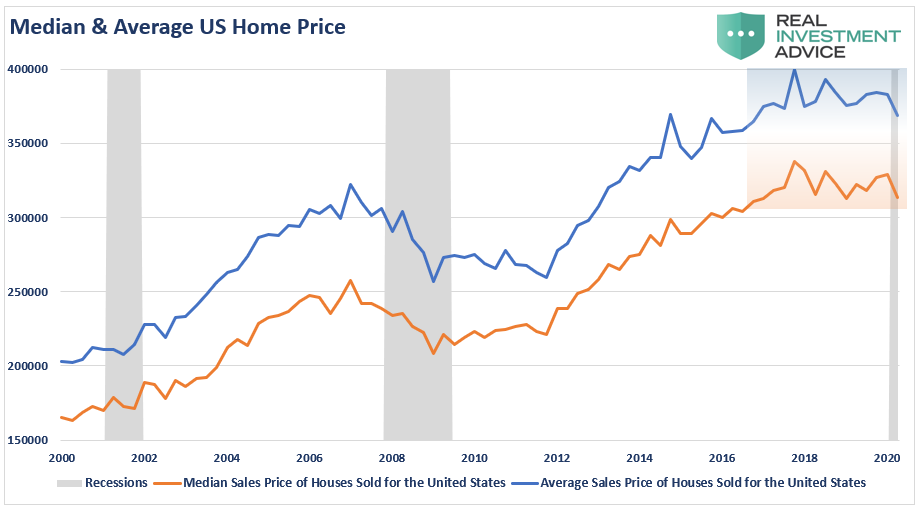
Given the vast majority of homeowners have not seen prices increase to a great degree since 2016, there is little incentive to “list homes for sale.”
People Buy Payments – Not Houses
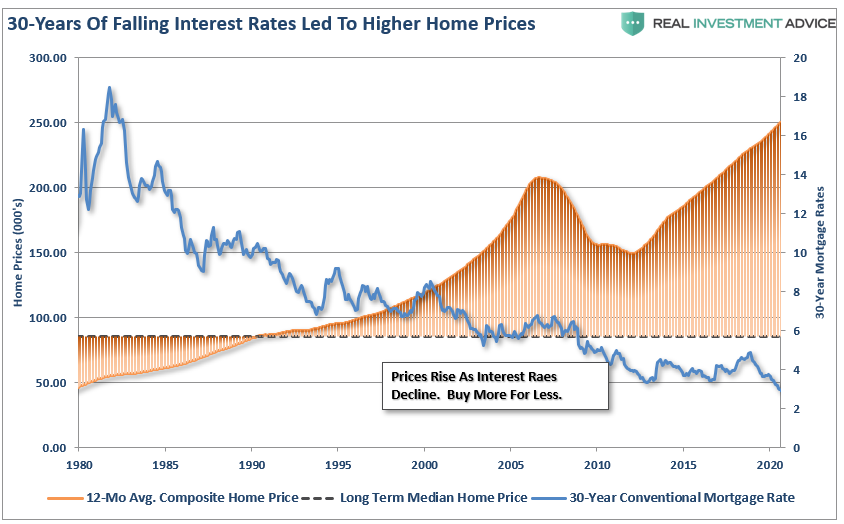
People do not buy houses – they buy a payment. The payment is what drives how much house they buy. Why is this important? Because it is all about interest rates.
Over the last 30-years, a significant driver of home prices has been the unabated decline of interest rates. When declining interest rates collided with lax lending standards – home prices soared off the chart. No money down, ultra-low interest rates, and easy qualification gave individuals the ability to buy much more home for their money.
As shown, home prices have remained well above the long-term median price since the late 1990s. Low-interest rates and lax lending standards only supported those prices.
It’s Not The Millennials
As noted, the current surging prices and home sales reside in only a select few cities on a national basis. The hope has been that “Millennials” were finally coming of age and buying homes. As noted by Pew Research, such is hardly the case.
“In July, 52% of young adults resided with one or both of their parents, up from 47% in February. The number living with parents grew to 26.6 million, an increase of 2.6 million from February.”
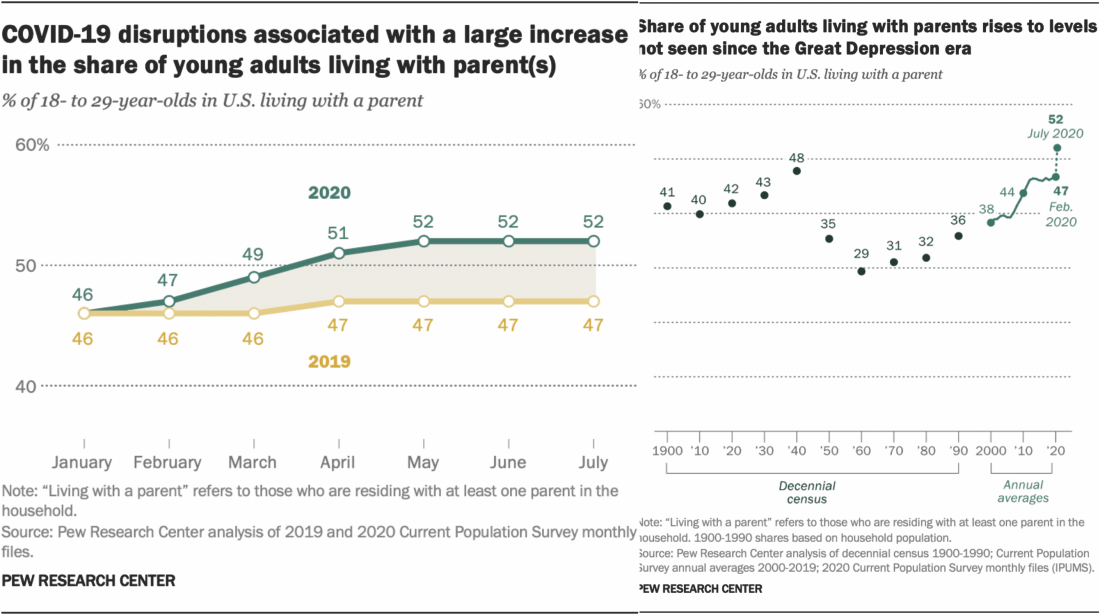
“The share of young adults living with their parents is higher than in any previous measurement (based on current surveys and decennial censuses). Before 2020, the highest measured value was in the 1940 census at the end of the Great Depression, when 48% of young adults lived with their parents. The peak may have been higher during the worst of the Great Depression in the 1930s, but there is no data for that period.” – PEW
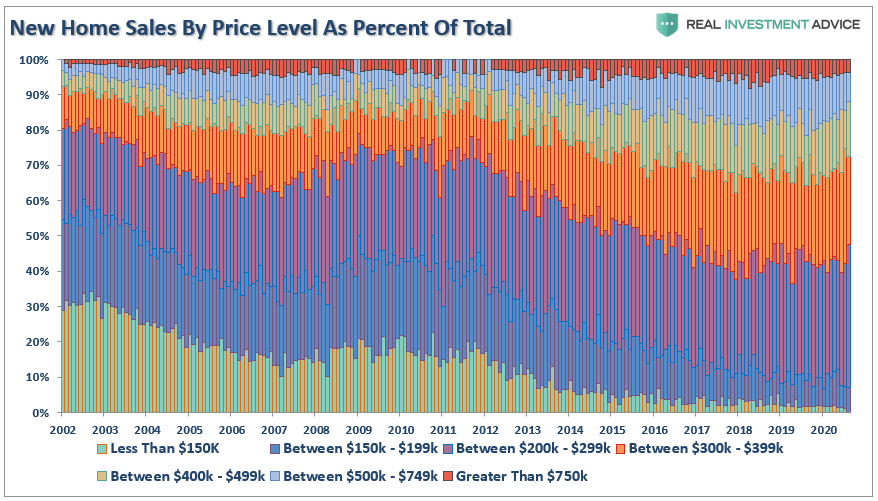
Such is why, on a national basis, there isn’t a massive demand for housing, except in the few major cities noted above. “New home” sales also tell us much the same. Higher priced homes seeing the most activity are between $200,000 and $500,000. While a $400,000 home is not a “starter home” in Texas, it may well be in California. There have been ZERO sales below $150,000.
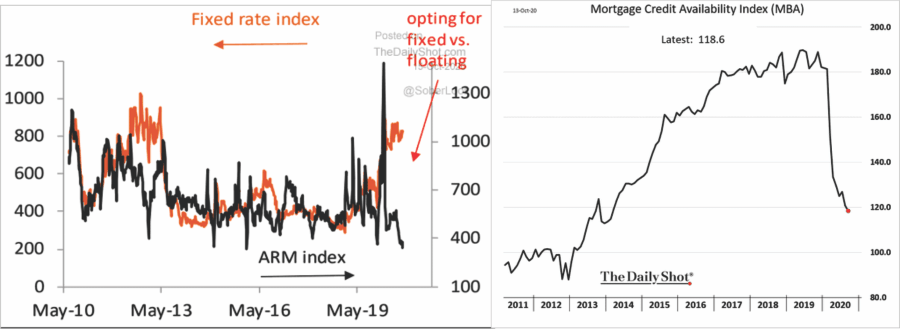
The problem for “Millennials” is low mortgage rates supporting the purchase of higher-priced homes with reduced monthly payments. Unfortunately, for many, a mortgage requires nearly perfect credit and steady income. With mortgage credit availability tightening as banks react to the recession, the pool of buyers is shrinking rapidly.
Recessions Increase Supply
Not surprisingly, recessions have a nasty habit of rapidly increasing the housing supply. As job losses mount, the available pool of buyers who can afford to buy a home sharply contracts. Given that “housing inventory” is a function of buyers versus the number of houses for sale, the numerator’s reduction matters much.
As shown in the long-term chart of housing inventory, recessions matter when it comes to inventory levels. The long-term linear trend of “supply” has remained at about 6-months on average since 1963.
The Return Of Supply
The current plunge in “available inventory” is not actually about the size of the “home buying cohort.” It says more about the current economy where a large portion of the economy is “unable” to move. When currently un- or underemployed, there is no option to “sell” their current home, as they cannot qualify to buy a “new” home.
Besides, there is plenty of supply waiting in the wings. There are a large number of homes whose mortgages are in forbearance and delinquent. If not cured, when the moratorium lifts in January, they will have to be sold. As noted by Wolf Richter
“There is lots of supply waiting in the wings, including:
- A portion of the homes whose mortgages are in forbearance and delinquent will have to be sold to cure the delinquent mortgage.
- Homes whose owners moved into their recently-bought new home which will end up on the market;
- And homes owned by investors for vacation rentals which will end up on the market if vacation rentals continue to be a drag in those cities.”
As we saw in 2005, and at every period in history leading up to a recession, the surge in supply can happen suddenly.
If interest rates rise sharply, more layoffs occur, banks tighten lending standards further, or if there is just a change in buyers’ attitude, inventory will surge higher.
The other problem is if the Federal Reserve becomes concerned that they have been complicit in juicing the housing market. With their aggressive buying of Mortgage-Backed Securities, they artificially suppressed rates encouraging a wave of refinancing and purchase activity.
As Wolf concludes:
“[The fed] is seeing this housing insanity, and after having already quietly mothballed its corporate bond-buying program, its repos, and its dollar liquidity swaps, it would be an unsurprising next step.”
Conclusion
As we head into 2021, potentially higher rates and continued economic weakness could collide with elevated housing prices in some areas. Such will result in the rapid reversion of “housing activity” and a surge in “supply.”
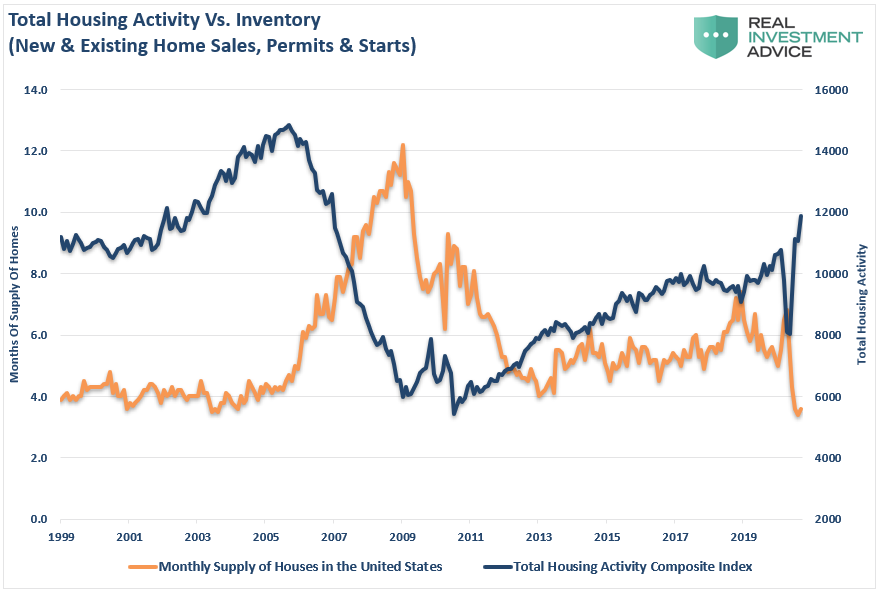
The next time you hear someone in the media saying the housing market will never go down again because of an “inventory shortage,” it may be worth questioning their view.
As with all data, it is crucial to understand the data’s calculation to derive its real meaning. The problem with most analysis by the media is they tend to extrapolate a current data point into an infinite future.
Reality rarely works that way.
