The major indexes continue to float higher around any and all obstacles…
The first week of December did not disappoint the seasonal traders as the major indexes continued in their upward ways. Leading assets and stocks continued to gain while any investment touching energy continued to be for sale. This pattern should continue into year-end as portfolio managers window dress into the market’s top stocks and sell losers to capture taxable losses. Energy assets could put in a bounce once the tax loss selling ebbs. The question will be whether or not it will only be a dead cat bounce on the way to new lows. With Saudi Arabia offering discounts on barrels of oil and no new OPEC meeting set until June, there is no way of knowing how much cheating on production the more financially desperate countries may commit. But losses by energy players will lead to significantly larger gains by global consumers and businesses who consume energy, which is causing new positioning in the financial markets right now. Until there is certainty around OPEC or a major uptick in global growth rates, Energy assets will remain in the penalty box.
Both the S&P 500 and the Dow Jones Industrial Average traded to all-time new highs on Friday. SPX leads in 2014 +12.3% v +8.3% due to more Healthcare & Technology and less Energy exposure…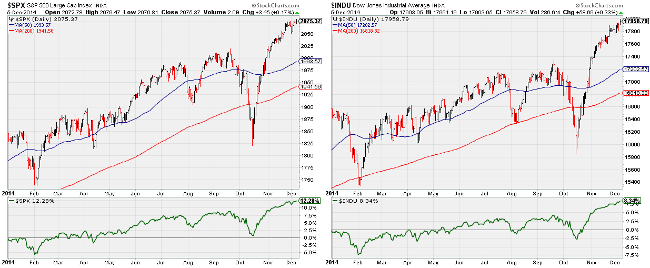
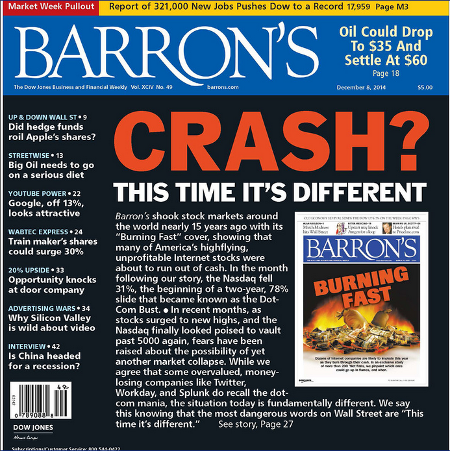
For Tech stock investors, let’s hope the Barron’s cover doesn’t jinx anything
December’s seasonality traders will be looking for a pause this week until the market ramps up for its final two weeks…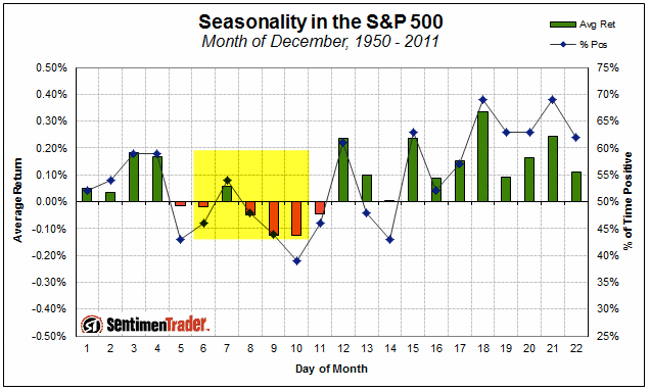
Back to the Energy price decline. Crude Oil traded to 2009 levels last week. Unlikely that any buyer wants to stick their neck out today with the production uncertainty of OPEC…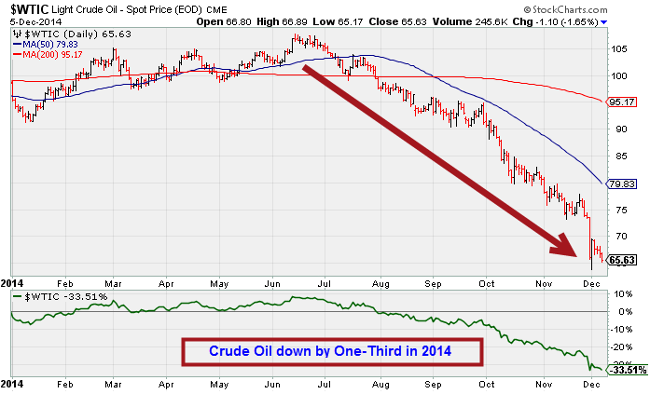
One event that you can certainly bet on is Energy project cancellations…
More than $150 billion in oil and gas projects worldwide are expected to be canceled next year as oil prices continue to fall. Norwegian consulting firm Rystad Energy is expecting companies to make final investment decisions on a total of 800 projects valued at $500 billion and totaling nearly 60 billion barrels of oil equivalent, according to Reuters. But one-third of the spending won’t get approved. The analysts estimate that half of overall volumes are at risk of being shut down if oil stays at $70 per barrel.
Falling energy prices have already begun ripping lower Energy company EPS estimates for the Q4…
As the price of crude oil has continued to decline during the fourth quarter (to $66.81 yesterday from $91.16 on September 30), analysts have also continued to lower earnings estimates for companies in the Energy sector in the S&P 500 for the fourth quarter. The Q4 bottom-up EPS estimate (which is an aggregation of the estimates for all the companies in the Energy sector) has dropped by 20.5% (to $9.49 from $11.94) since September 30.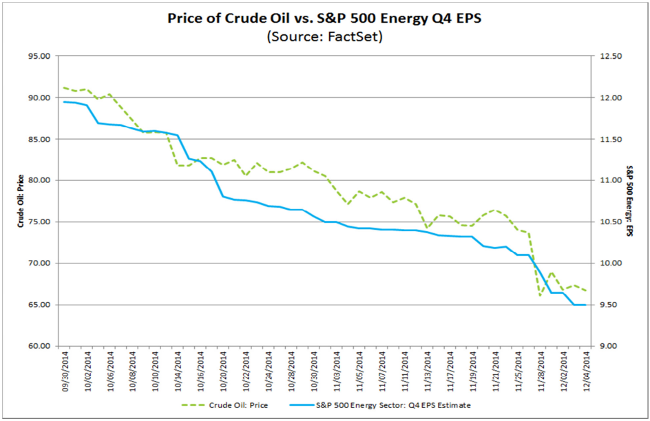
While Energy prices suffer, the U.S. Economy is shifting into a higher gear, as noted by the new highs in Friday’s Non-Farm Payroll data…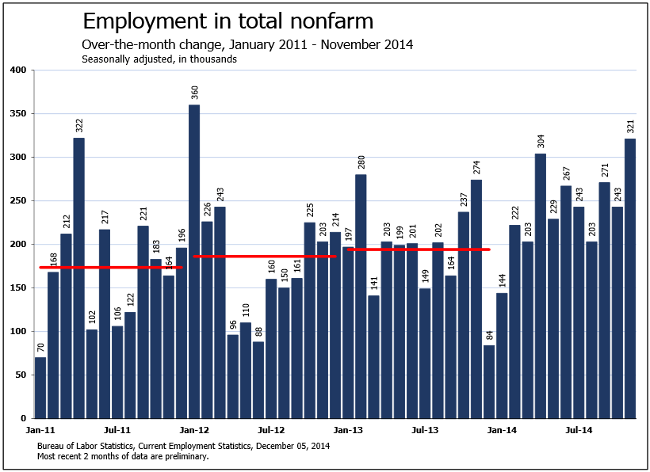
2014 is now looking toward the best Payroll gains since 1999…
Back in early October, it became apparent that 2014 was setting up to be the best year for nonfarm Payroll gains since 1999. Friday’s release of the November employment report only reinforced that likelihood. The report was solid across all metrics. The 321,000 jobs created significantly exceeded the estimate of 230,000. The net revision of the previous two months was an additional 44,000 jobs. Labor Force Participation held steady at 62.8%. The Unemployment Rate held steady at 5.8%. Another strong component of the number was Average Hourly Earnings coming in at 0.4% versus the estimate of 0.2%. January (due to the cold winter) was the only month this year that 200,000 or more jobs were not added. The caveat about the report is that the United States is not creating high quality jobs. While that statement is true, it is remarkable to hear people attempt to rationalize the need to continue Zero Interest Rate Policy despite the fact that this is the best pace of consistent monthly employment creation since the late 1990’s.
(JonesTrading)
And November Auto Sales continued with a strong pace even with the slowdown from the Ford Pickup’s changeover to aluminum…
Based on a WardsAuto estimate, light vehicle sales were at a 17.08 million SAAR in November. That is up 5.5% from November 2013, and up 4.5% from the 16.35 million annual sales rate last month.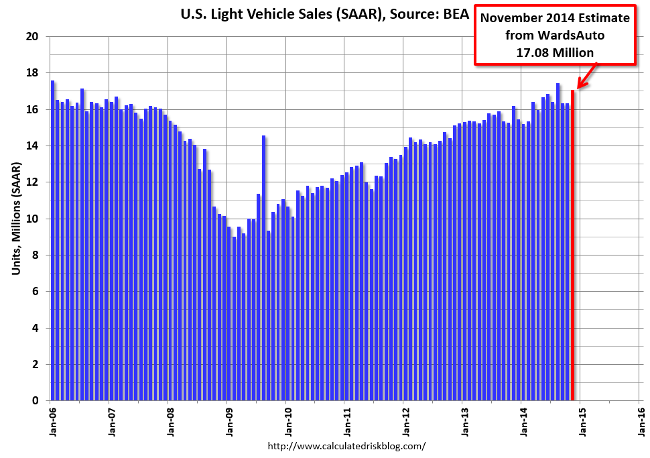
This recent home buyer survey even highlights the strengthening economy; potential buyers feel better about their jobs while at the same time are worried about rising home prices…

The week’s stronger U.S. economic data pushed short yields to their highest levels in 3 years…
@MktOutperform: 2-Year treasury yield highest since April 2011 as expectations for first rate hike moved forward after jobs report.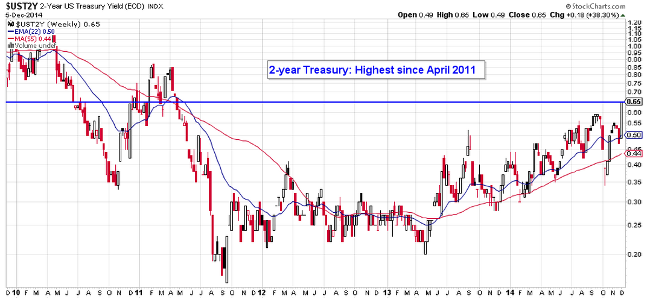
The rise in short-term interest rates led Financial stocks to win the week…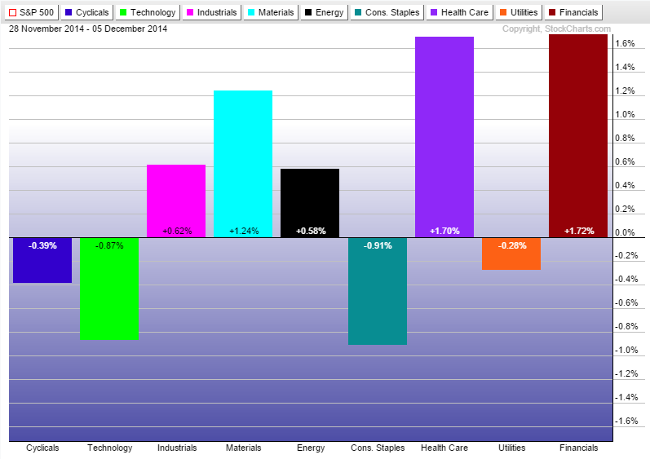
More broadly, U.S. Equity indexes led the asset classes while anything touching Energy remained for sale…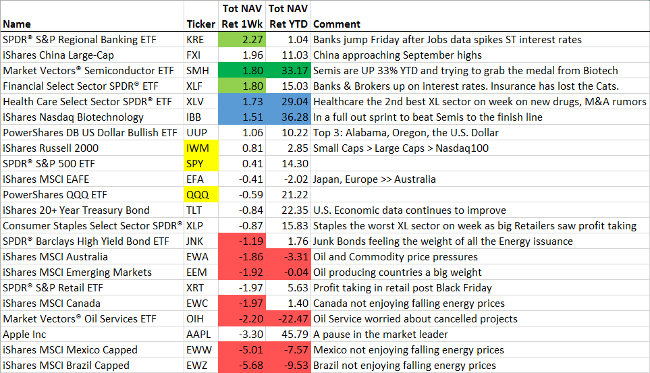
The U.S.Treasury’s Office of Financial Research has issued its latest report. While they noted the continued strengthening of the financial system, they also highlighted the increases in several risks that they see developing…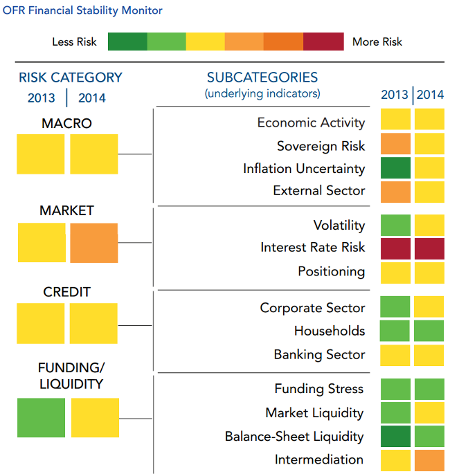
But little sign of risk in this chart as Italian 10-Year bond yields trade to all-time historic lows…
Italian bond yields have dipped below 2 per cent for the first time in history as data suggested the performance of the country’s services sector was strengthening.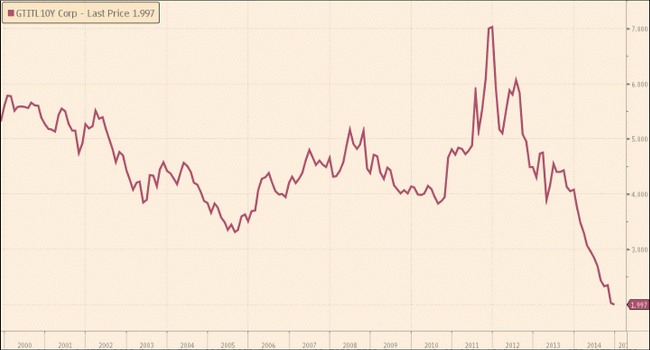
The growth in Indexing, ETFs, and Benchmark hugging is shifting the Risks v. Rewards in the Equity markets…
From 1970 to 2011, fund manager GMO shows that the 25 per cent of US stocks with the highest sensitivity to the market logged an average annual return of 7.2 per cent, with double the risk (defined by their volatility) of the 25 per cent of stocks with the lowest sensitivity to the market – which logged an annual return of 10.6 per cent. The risk-return relationship had been stood on its head… This is a recent phenomenon. Using data back to 1926, the risk-return trade-off is flat but not inverted – with the highest-risk stocks averaging 11.6 per cent returns, against 10.92 per cent for the lowest risk. Since 1968, there has been a deep inversion. The biggest change in the way money is invested over those years is that capital allocation is now controlled by large institutions, not individuals. They have increasingly used benchmarking. This is not just about passive index-tracking, which is a sensible way to minimize costs. It is standard practice to measure “active” managers against a benchmark, which is made public. They are required to keep their deviation from the index within certain bounds, to avoid the risk of embarrassing underperformance.
…And as investors gravitate towards performance, Vanguard benefits…
An annus horribilis for U.S. active fund managers drove a further $21.3bn into Vanguard, the leading provider of low-cost index tracker funds, in November the inflow was the mutual fund giant’s third-best monthly total. The Valley Forge, Pennsylvania-based company has brought in $185bn into its U.S. mutual funds in 2014 — an industry record.
…Of course Indexing will not always win. Look for the Q4 of 2014 to reward many portfolio managers who missed Energy stocks and bonds…
The average correlation for each of the 10 industry sectors in the S&P 500 is down to 58.4% over the last month. This is by far the lowest observation we’ve seen in the last +5 years; the prior low was 68.7% in July 2014. Every sector saw steep declines from the November data, when the average was 85.4%. Old-timers reading this note will rec all that “Normal” sector correlations are around 50%. Simply put, that means that half the price action for a sector should come from the overall tenor of the broad market and the other half should be based on industry fundamentals.
(Convergex)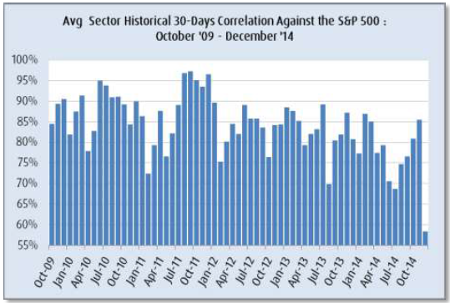
I know that there are one or two wine drinkers among this reader base, prices could be going lower as the biggest buyer in the world slows down…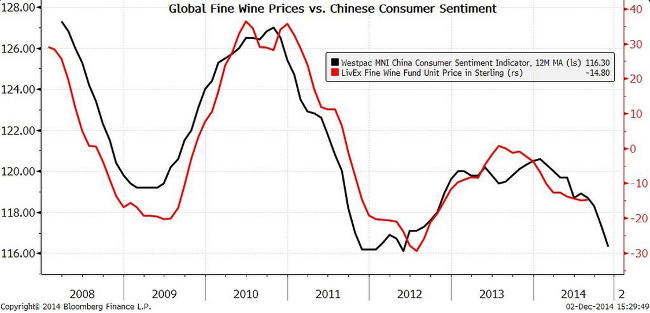
Looks like I am not the only one to use my two Chromebooks religiously…
In the third quarter, Google Inc (NASDAQ:GOOGL) shipped 715,000 Chromebooks to schools compared to 702,000 iPads from Apple. IDC said this was the first quarter Chromebooks had beat iPads in the classroom… Chromebooks are not just cheaper per unit, but they are easier to share, letting school districts buy fewer of them. You hand them out, students log into their account online, and they hand them back when they’re done. At home, since the curriculum is accessed through a browser, you can use pretty much any type of computer you already have at home to keep doing your work.
The other issue that makes the cost gap even bigger is the keyboard. School districts across the country are adopting the controversial Common Core curriculum, which involves a lot more writing for students to encourage more critical thinking. Yes, you can write on an iPad. Yes, you can buy a keyboard for an iPad (adding even more to the cost). But in the case of L.A. Unified, the district realized after the fact that students would need a keyboard to be able to take the standardized tests that are part of Common Core. This essentially made it a mandatory item.
Speaking of classrooms, Science classes became much more exciting last week as humanity moved one step closer to setting foot on Mars…
NASA’s Orion spacecraft, atop a United Launch Alliance Delta 4-Heavy rocket, lifts off on its first unmanned orbital test flight from the Cape Canaveral Air Force Station, Dec. 5, 2014, in Cape Canaveral, Fla. (Chris O’Meara/AP Photo)
We applaud this Brit’s display of excitement for last week’s launch…
Station staff members were left “befuddled” when an “astronaut” materialized on a railway platform during rush hour. The mystery passenger wore a helmet and NASA branded white suit as they waited to board a train at St. Albans City Station at 08:45 GMT on Thursday. Commuter Ross Chapman said staff looked “confused” by the occurrence. “The platform attendant called into his radio ‘could someone tell me why there’s an astronaut on platform one?’”, he said.
Disclaimer: The information presented here is for informational purposes only, and this document is not to be construed as an offer to sell, or the solicitation of an offer to buy, securities. Some investments are not suitable for all investors, and there can be no assurance that any investment strategy will be successful. The hyperlinks included in this message provide direct access to other Internet resources, including Web sites. While we believe this information to be from reliable sources, 361 Capital is not responsible for the accuracy or content of information contained in these sites. Although we make every effort to ensure these links are accurate, up to date and relevant, we cannot take responsibility for pages maintained by external providers. The views expressed by these external providers on their own Web pages or on external sites they link to are not necessarily those of 361 Capital.
