The stock market has now broken out to new all-time highs and many investors may be ill-positioned to take advantage of the latest surge. Based on sentiment indicators, fund flows, and structural positioning the overwhelming momentum has been with defensive areas of the market.
The unrelenting decline in interest rates and grasp for yield has been a tremendous beneficiary to traditional safe havens. Treasury bonds, utility stocks, REITs, low volatility indexes, and precious metals have all surged this year.
But what about the areas that have been overlooked or just plain abandoned altogether?
Some of these underrated categories include: financials, health care, and technology stocks. These key sectors have meaningfully lagged the market and as such are sporting much more attractive fundamental valuations. They may also be ripe to play catch-up as the next rotation cycle takes hold and underinvested portfolio managers look for bargains.
The following exchange-traded funds offer diversified, low-cost, and transparent exposure to a wide array of value stocks in an easy-to-access investment vehicle.
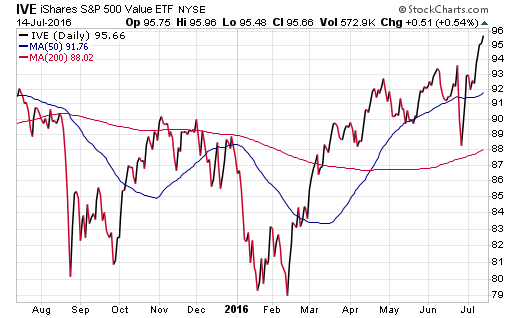
1. iShares S&P 500 Value ETF (NYSE:IVE)
IVE isn’t the biggest large-cap value ETF in the market, but it may be one of the easiest to understand. This fund has $10.6 billion dedicated to a group of 360 stocks picked from the S&P 500 Index for their intrinsic value characteristics.
This market cap weighted index allocates a greater percentage of the underlying assets to the largest stocks. Top holdings in IVE include well-known names such as Exxon Mobil Corp (NYSE:XOM), Berkshire Hathaway (NYSE:BRKb, NYSE:BRKa), and AT&T Inc (NYSE:T). Furthermore, the largest sectors represented are financials (23%), energy (13%), and healthcare (12%).

The fund charges a reasonable net expense ratio of 0.18% and has a 30-day SEC yield of 2.43%. It also sports a price/earnings ratio of 16.74 versus the iShares Core S&P 500 ETF (NYSE:IVV) P/E of 19.77.
I recently picked up IVE as a holding for clients of my wealth management firm after jettisoning a low volatility index. In my opinion, the tilt towards value metrics is a more attractive quality in the current environment. Many of the stocks represented in this fund have been out of favor for some time and have the potential to make up significant ground on overheated areas of the market.
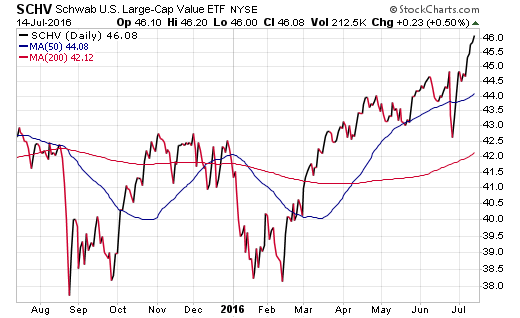
2. Schwab U.S. Large-Cap Value ETF (NYSE:SCHV)
If you are a true miser on fees, SCHV may be the right fund for you. This exchange-traded fund has the lowest overall expense ratio of all value ETFs at just 0.06% annually. It’s also available to be traded commission-free if your money is in a Charles Schwab (NYSE:SCHW) brokerage account.
SCHV tracks the Dow Jones U.S. Large-Cap Value Total Stock Market Index, which currently owns a diverse mix of 330 stocks. This distinctive index is weighted towards financial stocks (19.4%), consumer staples (14.4%), and technology companies (12.4%). The fund has $2.3 billion in total assets and sports a 30-day SEC yield of 2.81%.

It’s also one of the top performing value funds over the last twelve months with a gain of 8.04% through July 14. The overweight positioning in quality stocks like Microsoft Corp (NASDAQ:MSFT) and Procter & Gamble Company (NYSE:PG) has like contributed to the strong outperformance of the fund versus its peer group.
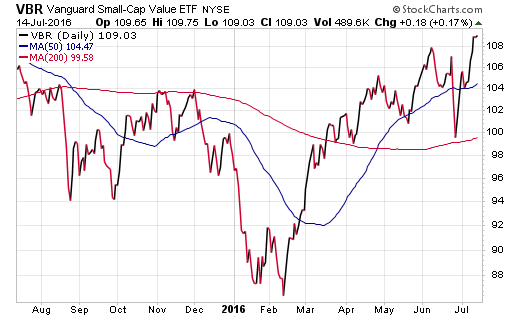
3. Vanguard Small Cap Value ETF (NYSE:VBR)
Another way to look at value stocks is searching for smaller companies with upside potential outside of the traditional large-cap arena. VBR encompasses a broad basket of over 850 small companies with a median market cap of $3.2 billion.
It’s also the fourth largest value ETF by assets at $7.7 billion and charges a minuscule expense ratio of 0.08%. This fund has just over 50% of its holdings concentrated in financial and industrial sectors.

Another positive item worth noting is that this small cap ETF has just broken out to new highs on its chart. By contrast, the more growth-focused iShares Russell 2000 (NYSE:IWM) is still struggling to recapture its prior peak.
Disclosure: FMD Capital Management, its executives, and/or its clients June hold positions in the ETFs, mutual funds or any investment asset mentioned in this article. The commentary does not constitute individualized investment advice. The opinions offered herein are not personalized recommendations to buy, sell or hold securities.
