With the (ARCA:SPY) trading in a wide range since the beginning of the year, many momentum investors may be searching for signs of life in alternative areas of the market. Just because the broad measure of U.S. stocks is waffling sideways, doesn’t mean that there aren’t suitable ETF candidates to add to your watch list at this juncture.
The following funds are just a few of the ETFs I have been monitoring over the past several weeks as they show positive technical divergences from their peers.
Guggenheim Solar ETF (ARCA:TAN)
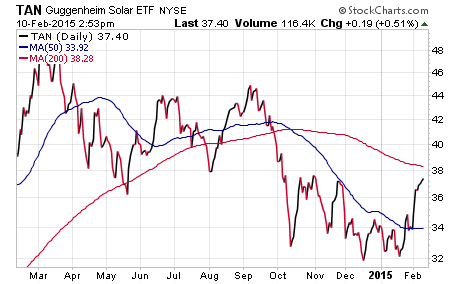
Solar stocks had a horrific year in 2014 that included various whipsaws and other erratic price action. They finished the year markedly lower despite positive net strength in large-cap indices such as SPY. However, they may be looking to turn those fortunes around in 2015 and have been showing a bias towards higher prices since bottoming in January.
TAN is the largest renewable energy ETF with over $300 million in total assets. This fund tracks 29 global solar energy companies engaged in the manufacture, installation, and maintenance of solar power equipment. The index is composed of 47% U.S.-based companies with the remaining allocation spread amongst China, Hong Kong, and other smaller nations.
As you can see on the chart below, TAN had some brief consolidation at its 50-day moving average and is now marching back towards its long-term 200-day moving average. Since the beginning of the year, this ETF has gained more than 9% and is continuing to show positive relative strength versus many sector alternatives.

Aggressive growth investors who can stomach heightened volatility may want to research solar ETFs as a possible comeback story for 2015.
Consumer Discretionary Select Sector SPDR (XLY)
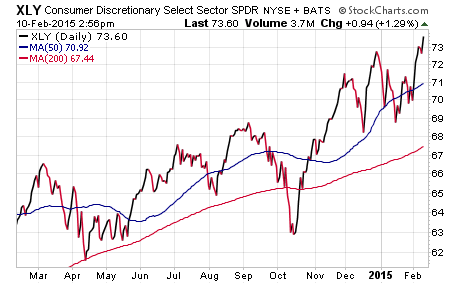
Consumer discretionary stocks are another area of the market that has shown strong momentum through earnings season.:XLY is heavily dominated by media, specialty retail, and other luxury goods sellers such as Walt Disney (NYSE:DIS) and Home Depot (NYSE:HD). This ETF contains 87 large-cap stocks and charges an expense ratio of 0.15%.
The strong vote of confidence for this sector came when it recently broke out above its 2014 highs and is continuing to show impressive overall strength. Many investors consider this ETF to be an indicator of consumer health, and judging by the price action, the trend of consumer spending habits continues in earnest.

XLY will certainly be an important sector of the market to watch as a potential growth-focused momentum trade in 2015.
iShares Core S&P Mid-Cap ETF (ARCA:IJH)
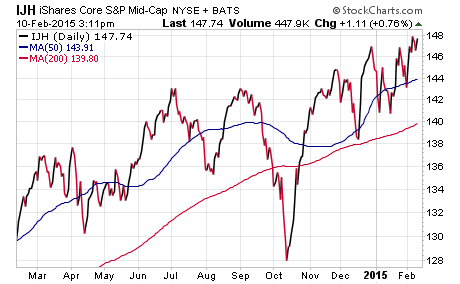
Mid-cap stocks are another area of the market, similar to XLY, which have newly peeked out above their 2014 high. IJH is the largest ETF in this space that tracks 400 mid-sized companies with market capitalization’s between $1.5 and $5 billion. This fund has over $24 billion in total assets and charges a modest expense ratio of 0.12%.
While mid-cap stocks don’t always get as much recognition as their large or small-cap peers, they do have the potential to be successful long-term growth candidates. The positive technical move in this space should be viewed as a sign of building momentum that may lead to outperformance versus SPY in 2015.

For my growth clients, I am accessing the mid-cap space through the Vanguard Mid-Cap ETF (NYSE:VO). This passive index follows a similar basket of 375 stocks and includes a lower expense ratio at 0.09%.
The Bottom Line
These growth themes show promising characteristics of momentum and strength versus plain-vanilla ETF alternatives. However, any new entrants in these ETFs should implement a stop loss or sell discipline to define your risk management strategy. In addition, when starting a new position, I typically recommend breaking up the trade in pieces so that you can add slowly over a limited time. This allows you to better control your cost basis and allocation size.
Disclosure : FMD Capital Management, its executives, and/or its clients may hold positions in the ETFs, mutual funds or any investment asset mentioned in this article. The commentary does not constitute individualized investment advice. The opinions offered herein are not personalized recommendations to buy, sell or hold securities.
