Deep in the bowels of the bible of technical analysis and a book more properly known as Technical Analysis of Stock Trends are many mentions of how to judge whether a trend or pattern has been made or broken officially and that is by seeing whether its defining level has been breached by 3%.
Such guidance is what has been referred to many times in this work as the 3% rule even though the fathers of technical analysis never put it quite that way. In this time of TV and Twitter, though, it seems an appropriate way to encapsulate that guidance even though it is not quite as hard and fast as the word “rule” might make it seem. Rather it is a guideline to consider and especially around the two-year sideways trend at play in the equity indices that many may believe has moved, or will be moving, toward an uptrend.
Interestingly, however, as impressive as the Operation Twist, swap line-backed LTRO rally has been, it has failed to pass the 3% rule outside of the turbo-charged Nasdaq Composite and this is something to think about in the context of that very vicious sideways trend that may reemerge and one that is most likely to break to the downside based on the very bearish intermediate- and long-term look of the weekly charts.
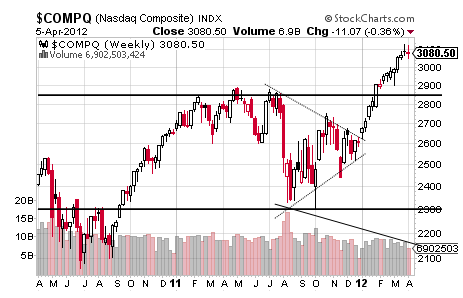
Let’s treat first, though, the exception to the rule and that is the aforementioned Nasdaq Composite that took the opportunity to break out of what had been presenting as a bearish Symmetrical Triangle early this year in a nearly parabolic move and a move that occurred only one other time in history and that is none other than late 1999 and just six short months before the unforgettable unfurling of the tech bubble in March 2000.
Before looking at that long-term picture that is rich with reasons to become very bearish on equities, it probably makes sense to start with the shorter sideways trend shown below along with the scary Double Spike Top born of the last two weeks.
It confirms at 3053 for a target of 2972 and a level that would mean the 3% rule held using last year’s intraday high of 2888.
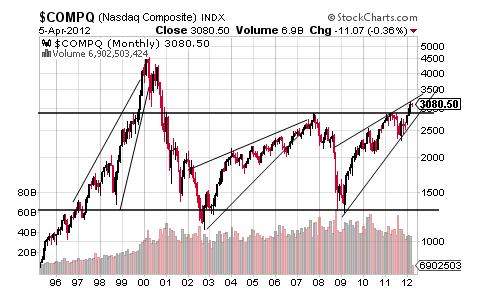
Put otherwise, should the Nasdaq Composite’s Double Spike Top work out, its long-term trend is not reversing up from sideways but is simply sideways and something that makes excellent sense in the context of the more than decade long monthly chart shown below.
This possibility will put the focus, though, on the degree of sideways with the bottom of that long-term Sideways Trend Channel equaling a crash bigger than 2008 due to this year’s AAPL-mania and good reason to believe that you reap what you decide to believe in.
That being said, maybe investors continue to believe that the outrageous borrowing binge will not press the equity markets back toward pre-binge levels and about 400 on the S&P and in that case, perhaps the Nasdaq Composite somehow presses higher to take on the great peak of late 1999 and early 2000.
Such a scenario is unlikely, though, until the Nasdaq Composite at least makes another touch to the bottom trendline of the Rising Wedge at about 2900 before moving higher to take on the 3% rule again and a criterion that it has currently passed but with it seeming unlikely that this will last for too long with the sideways trend taking some claim on this index whether minor or significant and whether brief or lasting.
It is the other indices, however, that actually have given me more faith in the 3% rule considering that the Dow Jones Industrial Average has closed above 13260 only once and only by 4 points as the S&P has done a little better to close above 1412 four times with both indices below those respective levels yesterday.
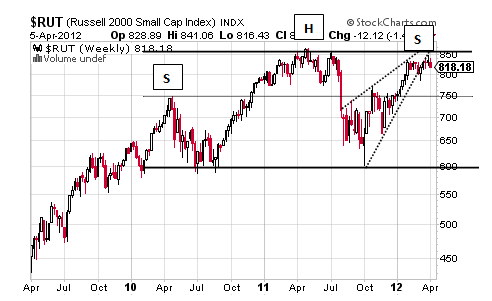
Rather than showing those charts with the Dow suffering more than the S&P and probably due to its lack of AAPL support, let’s turn to the chart of the Russell 2000 that has not only not taken out last year’s record high by 3% but has almost been contained below that level by 3%.
In turn, it is the Russell 2000 that is observing the 3% rule the most of the equity indices followed here in what is an unbelievably bearish chart set-up that becomes even more bearish in a slightly longer, and not shown here, chart.
As can be seen, a two-year Sideways Trend Channel has been holding the Russell 2000 rather brilliantly and one that allows for this small cap index to continue to trade in the upper regions of its sideways trend or to drop toward its middle or even its bottom with a move up and out of that region by 3% looking the least likely.
Sometimes it is the least likely thing that happens in the charts and particularly in the context of the very creative liquidity efforts of the world’s central banks, but there’s the big H&S in small cap that’s been shown a number of times in recent weeks that is progressing just perfectly and particularly now that the Rising Wedge is trying to confirm and something that would leave the Russell 2000 with a rather distinct right shoulder as is the case in the XLE.
Unless the Russell 2000 closes above 895, it will continue to obey the 3% rule even if it trades at or above current levels for weeks and months and this potential obedience points to one thing and that is a very vicious sideways trend and something that suggests it will not be years before the Russell 2000 finds the bottom of that Sideways Trend Channel around 600 for a nearly 30% decline.
Whether that possible move turns into the 60% correction from current levels augured by that Head and Shoulders pattern is to be seen, but what can be seen now is the fact that should the 3% rule continue to hold, it points to simply sideways at best with the next noticeable move, irrespective of timing, being about a big move down.
Sam’s Stash, Gold and the S&P
This section is still on break for the holiday weekend but will be back next Friday to look at Treasurys, the dollar, gold or maybe the index with which it all began and that is my favorite the S&P.
- English (UK)
- English (India)
- English (Canada)
- English (Australia)
- English (South Africa)
- English (Philippines)
- English (Nigeria)
- Deutsch
- Español (España)
- Español (México)
- Français
- Italiano
- Nederlands
- Português (Portugal)
- Polski
- Português (Brasil)
- Русский
- Türkçe
- العربية
- Ελληνικά
- Svenska
- Suomi
- עברית
- 日本語
- 한국어
- 简体中文
- 繁體中文
- Bahasa Indonesia
- Bahasa Melayu
- ไทย
- Tiếng Việt
- हिंदी
3% Rule Continues To Hold
Published 04/08/2012, 02:01 AM
Updated 07/09/2023, 06:31 AM
3% Rule Continues To Hold
3rd party Ad. Not an offer or recommendation by Investing.com. See disclosure here or
remove ads
.
Latest comments
Install Our App
Risk Disclosure: Trading in financial instruments and/or cryptocurrencies involves high risks including the risk of losing some, or all, of your investment amount, and may not be suitable for all investors. Prices of cryptocurrencies are extremely volatile and may be affected by external factors such as financial, regulatory or political events. Trading on margin increases the financial risks.
Before deciding to trade in financial instrument or cryptocurrencies you should be fully informed of the risks and costs associated with trading the financial markets, carefully consider your investment objectives, level of experience, and risk appetite, and seek professional advice where needed.
Fusion Media would like to remind you that the data contained in this website is not necessarily real-time nor accurate. The data and prices on the website are not necessarily provided by any market or exchange, but may be provided by market makers, and so prices may not be accurate and may differ from the actual price at any given market, meaning prices are indicative and not appropriate for trading purposes. Fusion Media and any provider of the data contained in this website will not accept liability for any loss or damage as a result of your trading, or your reliance on the information contained within this website.
It is prohibited to use, store, reproduce, display, modify, transmit or distribute the data contained in this website without the explicit prior written permission of Fusion Media and/or the data provider. All intellectual property rights are reserved by the providers and/or the exchange providing the data contained in this website.
Fusion Media may be compensated by the advertisers that appear on the website, based on your interaction with the advertisements or advertisers.
© 2007-2024 - Fusion Media Limited. All Rights Reserved.
