REITs are on sale again. Last week’s better-than-expected jobs report sent bond yields soaring and caused the prices of anything that “looks” like a bond—such as conservative REITs—to drop like a rock.
We’ve seen this show before, and we already know how it ends. It appears that we’ve fallen into a repeating cycle:
- Fed announces that quantitative easing will continue indefinitely, so long as employment picture is weak.
- Yields fall and the prices of income investments drift higher.
- A positive blip of economic data causes investors to panic, fearing that tapering is imminent.
- Yields soar and the prices of income investments plummet.
- Fed clarifies that economy is still weak…and reiterates step one.
I don’t want to get into the game of Fed handicapping because, as we’ve seen over the past six months, the Fed seems to have a real talent for doing the unexpected. But just for grins, let’s take a look at the jobs report that caused the last selloff.
The economy added 204,000 jobs in October, significantly higher than the 120,000 expected by the Street. Yet the unemployment rate actually ticked up a little, from 7.2% to 7.3%. Average hours worked was unchanged, and the number of persons employed part time rather than full time for “economic reasons” was little changed. And the labor force participation rate—which Chairman Bernanke took note of in his last announcement—declined fairly sharply from 63.2% to 62.8%.
Most importantly, one month does not make a trend, and all of these numbers are subject to revision.
Will the Fed taper this year?
Maybe. Maybe not. I’m not sure if even Chairman Bernanke or Janet Yellen know the answer to that question at this point. But regardless, my income strategy is the same. I am opportunistically picking up shares of REITs that are raising their dividends whenever I see a selloff. And today, I’ll share five of my favorites.
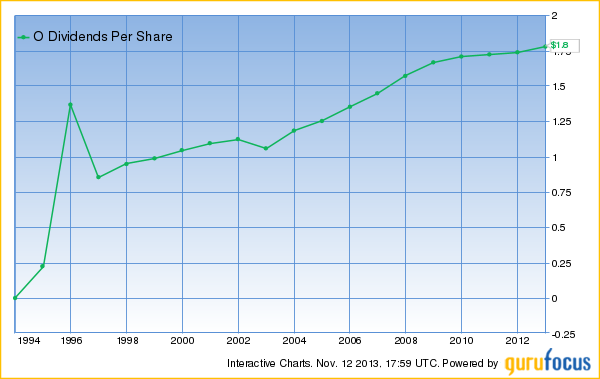
The first is Realty Income (O), also known as the “Monthly Dividend Company.” Realty Income has been a dividend-paying and dividend-raising monster since going public in 1994. In 19 years, it’s made 519 dividend payments and hiked the dividend 73 times. 
Realty Income’s conservative portfolio of triple-net-leased properties has been a rock of consistency throughout the past five years of on-again, off-again crisis. But that bond-like stability is exactly what is hurting the share price today. Because the company locks its tenants into long-term leases, rents tend to rise slowly and consistently. That’s great during a time of stable or falling bond yields. But when yields are soaring–as they are today–it makes the REIT less attractive as a bond substitute.
At $40.00, Realty Income sports a current dividend yield of 5.46%. And again, the payout will almost certainly grow with time, raising your yield on cost. Given the quality of the portfolio—and given its history of weathering crisis—I would gladly take 5.5% from Realty Income over 2.7% from “safe” Treasuries from a bankrupt and disfunctional federal government.
I recommend accumulating shares of Realty Income at or below $42.00. I’m actually comfortable buying at higher prices, but I see no reason to pay them at this time. Be patient and accumulate new shares every time we get a taper scare. You’re locking in a great yield on a stock you can hold forever. And yes, I mean “forever” literally.
Next on the list is National Retail Properties (NNN), a competitor of Realty Income’s in the triple-net retail space. For those unfamiliar with the term, in a “triple net” lease the tenant is responsible for property taxes, insurance and maintenance. If a pipe breaks or a health inspector discovers black mold, it’s not the landlord’s problem.
This makes the revenues and profits of triple-net leased properties ridiculously stable, assuming your tenants are good credits and your occupancy rates are stable. And this is certainly the case for National Retail Properties. The REIT owns 1,850 properties across 47 states with a total gross leasable area of approximately 20.3 million square feet. Current occupancy is 98.1%.
Tenant concentration is sometimes a risk for triple-net landlords. Not so for National Retail Propertoes. The REIT has more than 350 tenants in 38 industry classifications. 
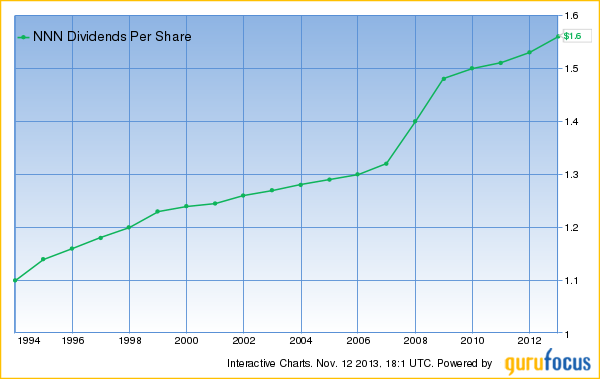
National Retail Properties has raised its dividend for 24 consecutive years and currently yields 5.0%. I would recommend buying every time it dips below $35.00.
And finally, we come to Digital Realty Trust (DLR), a REIT that specializes in data centers. 2013 has been a rough year for REITs in general, but DLR has been beaten like the proverbial red-headed stepchild. Earlier in the spring, hedge fund Highfields Capital made a very public short bet on Digital Realty, noting that the REIT was facing new competition from the likes of Amazon.com (AMZN), Microsoft (MSFT) and Google (GOOG) among others. 
Digital Realty’s quarterly earnings seemed to confirm this; earnings came in below expectations, and funds from operations (FFO) were actually down year over year. And management has lost serious credibility with Wall Street, as they fumbled an announced accounting change (which actually brings the REIT more in line with GAAP) and have generally done a poor job of communicating.
Yet this bearish story doesn’t seem to fit reality. The REIT's two primary competitors—CoreSite Realty (COR) and DuPont Fabros Technology (DFT)—have been reporting healthy FFO increases, indicating that the macro environment cannot be as bad as Highfields seems to think. And Digital Realty has continued to grow its portfolio, with lease signings through the first three quarters of 2013 already higher than full-year 2012.
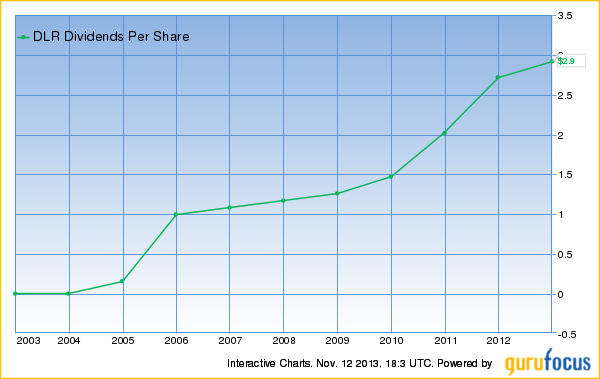
Digital Realty is a very different type of REIT than O or NNN. It operates in a more volatile sector and lacks their long track records. But as an investor, you’re also getting paid handsomely to accept these risks. Digital Realty sports a current yield of 6.8%, and the payout has been growing steadily.
Company insiders certainly appear to see value. Three officers have made significant purchases since August, buying throughout the share price decline.
Again, Digital Realty is more speculative than O or NNN. But at current prices, I would hardly call it risky. I would recommend accumulating shares below around $52.00 per share. At time of writing, the shaes traded for $46.03.
Disclosure: Charles Lewis Sizemore, CFA, is the chief investment officer of the investment firm Sizemore Capital Management. As of this writing, he was long O and NNN. Click here to receive his FREE 8-part investing series that will not only show you which sectors will soar, but also which stocks will deliver the highest returns. This series starts Nov. 5 and includes a FREE copy of his 2014 Macro Trend Profit Report.
