- The benchmark 10-year Treasury yield fell last week despite another Fed rate hike
- The Reuters Tankan Index should reaffirm the outlook for a recovery for Japan
- Japan’s third-longest postwar expansion could become its second-longest
- The Mexican peso reached a 13-month high against the US dollar last week
Softer inflation data seems to be weighing on the US 10-year Treasury yield, despite last week’s decision by the Federal Reserve to raise interest rates again. Will the disinflationary sentiment continue to push the 10-year rate lower this week? Meanwhile, Japan’s economy, which has enjoyed encouraging news lately, is in focus with today’s release of the Reuters Tankan Index for June. In forex markets, the USD/MXN will remain topical as the Mexican peso’s strong recovery this year against the US dollar rolls on.
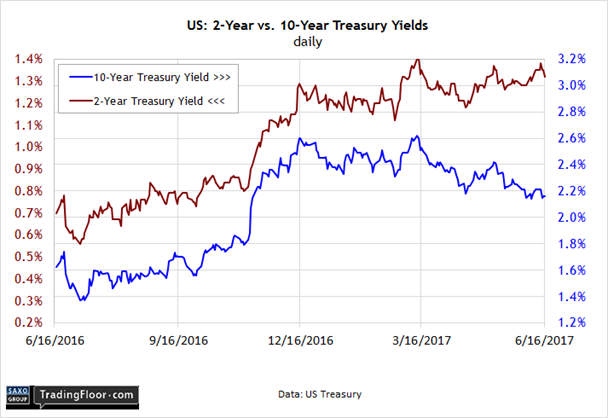
US: 10-Year yield: The Fed explained last week’s rate hike as a decision grounded in upbeat economic expectations. But the benchmark 10-year Treasury isn’t convinced.
Thanks to the central bank, the short end of the yield curve remains at or near the highest levels since the recession ended in mid-2009. The long end of the curve, by contrast, remains relatively depressed. As a result, the yield curve has become increasingly flat this year.
At last week’s close, the 10-year/two-year spread, for instance, settled at 84 basis points, close to a seven-month low. The relatively thin spread suggests that the Treasury market is expecting slow-to-modest growth and softer-than-expected inflation. If the spread inverts at some point and the two-year yield exceeds the 10-year rate, that would be a signal that the crowd’s pricing in elevated odds of a recession.
Economic growth is still the likely path for the near term, but the crowd has turned cautious, according to Treasuries. Will the wary sentiment continue to squeeze the yield spread? The economic schedule is light this week and so yields may stick to a narrow range in the days ahead until economic data gives the market new guidance.
Meantime, traders will continue to digest the Fed’s decision to raise rates despite the recent slowdown in inflation. The annual pace of consumer price inflation in May fell below the Fed’s 2% target for the first time in six months. According to some analysts, that’s a recipe for an even flatter curve.
“The fact that the Fed is tightening against the backdrop of slowing inflation implies that the market continues to price in policy error,” the head of US rates strategy at Citigroup advised last week.
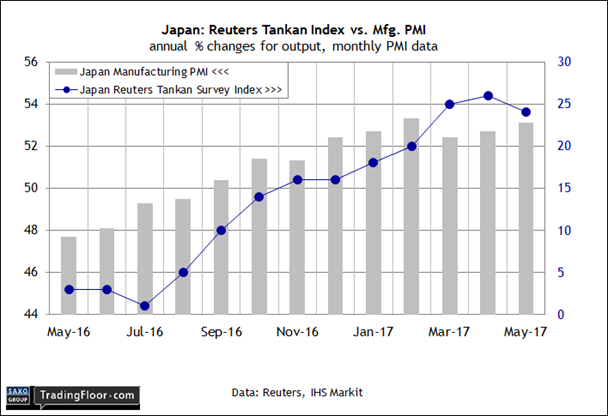
Japan: Reuters Tankan Index (2300 GMT): Japan’s third-longest postwar expansion is underway. Will it survive to become the second-longest run? Today’s update of the Tankan Index – a benchmark that tracks sentiment at large Japanese firms – may drop a fresh clue.
The Bank of Japan is optimistic these days. The central bank last week raised its growth estimate for the 2017-2018 fiscal year to 1.6%, up slightly from the previous forecast of just 1.5%. “Private consumption has increased resilience against a background of steady improvement in the employment and income situation,” the BoJ announced.
Sentiment data via this month’s PMI releases also paint a firmer path for expected economic activity. “Concurrently stronger growth in the manufacturing and service sectors during May underpinned the best rise in overall activity in just under three-and-a-half years,” a senior economist at IHS Markit said earlier this month.
Now-casting.com’s current estimate for the second quarter sees GDP growth accelerating to a 1.0% quarterly pace, up sharply from 0.3% in Q1. Today’s update of Tankan Index for June may reveal if Japan’s corporate sector also anticipates firmer economic activity ahead.

USD/MXN: Maybe’s it’s the big-fade on President Trump’s tough talk on cross-border trade between the US and Mexico. The recent news that Mexico’s inflation jumped to an eight-year high is a factor too, since it raises the odds of an interest rate hike, which would further enhance the appeal of the Mexican peso.
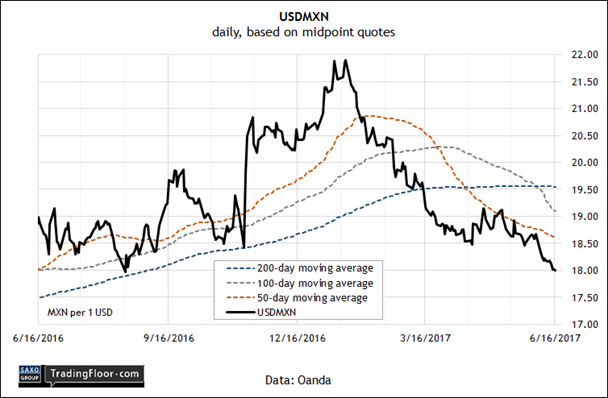
Whatever the reason (or reasons), the peso has been on a tear against the US dollar this year. USD/MXN on Friday dipped below 18, close to its firmest reading in more than a year (lower values of USD/MXN equate with a stronger peso).
The technical backdrop certainly looks bullish for the peso versus the US dollar. USD/MXN is trading well below several key moving averages and the 100-day average recently tumbled below its 200-day counterpart. Downward momentum for USD/MXN, in short, looks solid.
Additional support for the peso is expected via the projected rate hike by the Banco de Mexico on Thursday. The central bank’s 6.75% target rate is on track to rise to 7.0%, according to TradingEconomics.com’s consensus forecast.
“Bank of Mexico has increased the policy rate by 375 basis points versus the Fed's rate increase of only 100 basis points,” noted the Latin America director at Moody's Analytics. “This has stopped capital outflows from Mexico and has also attracted more investment into the domestic money market.”
The peso's rally can't last forever, but for the near term the currency looks poised to strengthen further against the greenback.

Disclosure: Originally published at Saxo Bank TradingFloor.com
