- Recent updates suggest that the US manufacturing downturn is easing
- The NY Fed’s data for May should show healing for this battered sector
- US home builder sentiment is on track for another upbeat reading in May
- Will the yen’s rally against the US dollar this year continue?
An early look at US manufacturing sector activity in May is on tap today, with an update of the New York Fed’s regional manufacturing data. We’ll also see the May report on US home-builder sentiment. Meantime, forex traders will be watching USD/JPY after the yen's year-to-date rise against the US dollar.
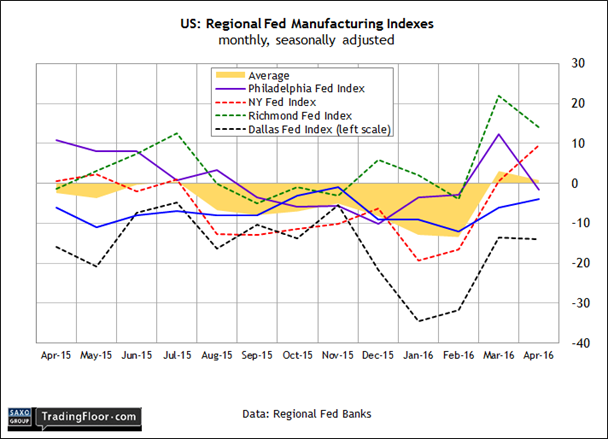
US: New York Fed Manufacturing Index (1230 GMT): Recent updates suggest that the manufacturing downturn is easing. Regional benchmarks via five Federal Reserve banks point to a mild recovery in March and April. Today’s first look at numbers for May via the New York Fed’s report will provide more guidance for deciding if the forward momentum is strengthening as the second quarter unfolds.
Survey data looks encouraging. Econoday.com's poll of economists projects that the New York Fed index will ease to 7.0 in May versus 9.6 in the previous month, but that still points to a modest growth rate. If the forecast holds, the preliminary data for this month will support expectations for an ongoing if precarious recovery in manufacturing.
National data for manufacturing have been hinting at a firmer trend too. The ISM Manufacturing Index in April remained above the neutral 50 mark for the second month in a row—the first back-to-back positive values for this benchmark since last summer.
Adding to the sense that a stronger tailwind is blowing for economic activity generally is Friday’s upwardly revised nowcast for US GDP growth in the second quarter via the Atlanta Fed. The Fed bank upgraded its projection to 2.8% for Q2 (seasonally adjusted annual rate), courtesy of a strong rebound in retail sales for April.
If today’s release from the New York Fed falls in line with the consensus view, the case will strengthen for expecting more healing in the manufacturing sector in May.

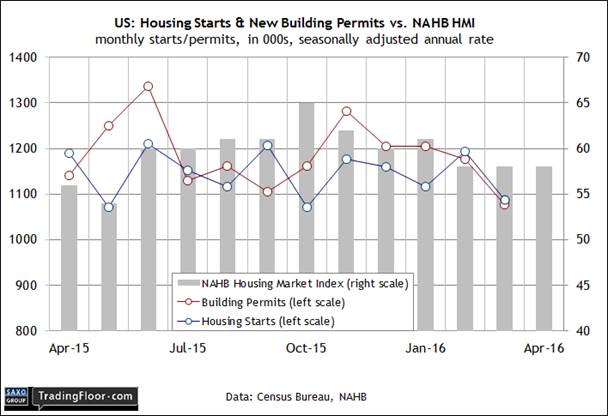
US: NAHB Housing Market Index (1400 GMT): The weakness in residential housing construction in March has some analysts worried, but home builders remain upbeat about the near-term future for the sector.
Indeed, the Housing Market Index—a monthly benchmark that tracks home builder sentiment—held at 58 for the third month in a row in April. That’s below previous highs, but the high-50s numbers still reflect optimism.
“Builder confidence has held firm at 58 for three consecutive months, showing that the single-family housing sector continues to recover at a slow but consistent pace,” said the chairman of the National Association of Home Builders in last month’s report. “As we enter the spring home buying season, we should see the market move forward.”
If today’s update for May sticks close to recent readings, housing construction may firm up after soft month at the end of the first quarter. In fact, Econoday.com’s consensus forecast sees a slight rise for HMI to 59 for this month, which would mark the highest level since January. In that case, the news will hint at a bounce for residential construction activity in the months to come.

USD/JPY: The US dollar’s mini rally against the Japanese yen this month has inspired some analysts to forecast that the greenback still has room to run. Technical indicators point to ongoing strength for USD/JPY, according to research from Scotiabank. “We look to fresh May highs and note the absence of resistance ahead of ¥111.50,” advised forex analysts at the firm via a report on Friday at ExchangeRates.org.uk.
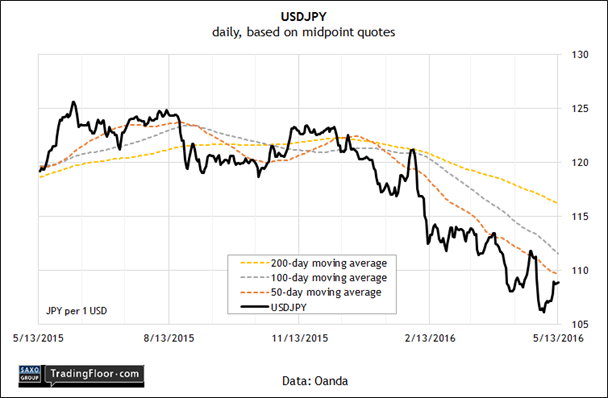
Perhaps, although the longer-run headwinds still look quite strong. Note that the USD/JPY is still trading below its 50-day, 100-day, and 200-day moving averages, based on daily data as of last Friday. Arguing that the year-to-date bearish trend for the dollar is reversing remains a contrarian view, although it will find deeper support if USD/JPY can decisively move and hold above the ¥110 level. For the moment, however, that's a bit of a climb relative to last week's close for USD/JPY at just below ¥109.
Traders will look for fresh catalysts in the economic data this week to confirm or deny expectations, including updates on industrial production and the Q1 GDP report.
Meantime, a key question for the near-term outlook for the USD/JPY is whether the Bank of Japan will ramp up its monetary stimulus. Some analysts expect no less at the central bank’s policy meeting in June. If so, the outlook for a weaker yen (that is, a rise in USD/JPY) will resonate.
"In the second half of the year, we could see dollar/yen go back to between ¥120-¥125,” a currency strategist at Tempus Consulting told Reuters last week. Part of the rationale is expecting a muscular round of BoJ intervention next month to reverse the yen’s bull run against the dollar so far this year.

Disclosure: Originally published at Saxo Bank TradingFloor.com
