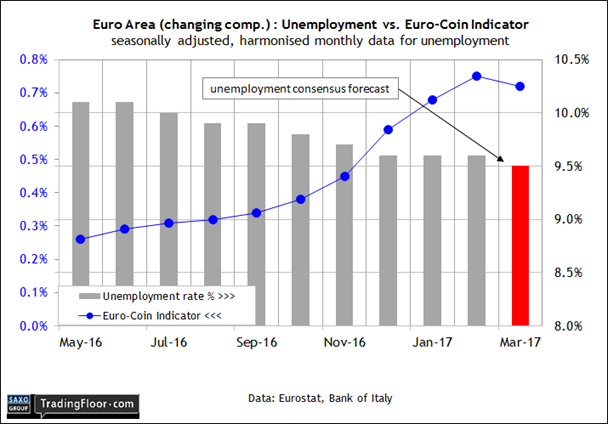
- February unemployment in the Eurozone should hit its lowest rate since 2009
- The 9% plus levels are still high, but there are now grounds for hope on jobs
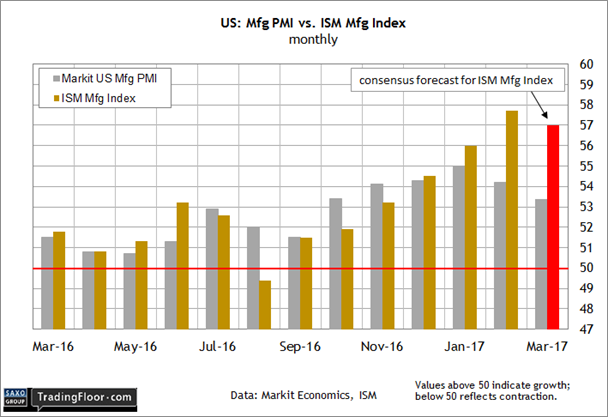
- US ISM Manufacturing Index should dip in March after hitting a 16-month high
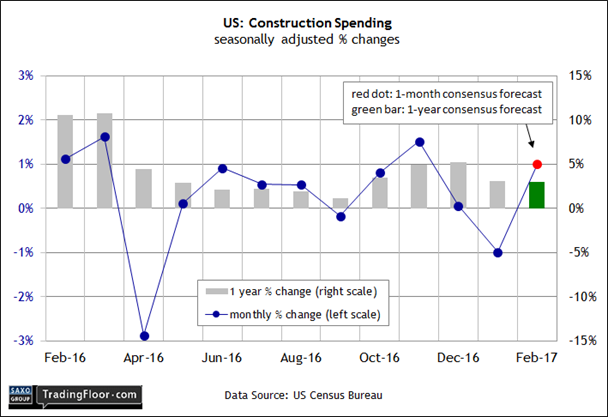
- Construction spending in the US is projected to rebound in February
April kicks off with a busy day of economic news, including the March update on unemployment in the Eurozone. Later, two US numbers will receive close attention for revising the economic outlook: the ISM Manufacturing Index for March and construction spending in February.
Eurozone: Unemployment (0900 GMT): A new round of estimates of GDP growth for the first quarter of this year continue to point to an acceleration in economic activity. Will today’s hard data on unemployment in the Eurozone confirm the optimistic projections?
Let’s start by reviewing a pair of new updates for Q1 GDP. The Bank of Italy’s Euro-Coin Indicator for March posted a 0.72% quarterly increase for the three months through March. Although that’s fractionally below the previous estimate, it still marks a solid improvement over the 0.4% rise in last year’s Q4.
Now-casting.com’s revised Q1 projection also dipped, edging down to a 0.58% quarterly gain. But here, too, the data points to a healthy improvement over growth in 2016’s final quarter.
A degree of support for thinking positively is expected in today’s jobless rate for March. TradingEconomics.com’s consensus forecast sees unemployment for the euro area inching lower to 9.5% from 9.6% previously. That’s still a high rate, but the estimate equates with the lowest level since 2009, implying that Q1 GDP growth is still on track to improve over the previous quarter.

US: ISM Manufacturing Index (1400 GMT): Survey data for US manufacturing continues to hold on to gains after last year’s slowdown and today’s update for March is expected to reaffirm that the rebound is in intact.
The consensus forecast sees the ISM Manufacturing Index inching down to 57.0 for March from 57.7 previously, but that’s still far above the neutral 50 mark. The expected reading in today's data also marks a strong rise from last August, when the index briefly dipped into contractionary territory, raising concerns at the time that the sector was headed for rough times.
Fast forward to this year’s first quarter and it’s clear that manufacturing activity is growing at a healthy clip. Note, however, that Markit’s competing Manufacturing PMI posted a softer rate of growth, dipping to 53.4 for this month’s flash data, down from 54.2 in February. That’s a clue for wondering if today’s first look at the ISM figures for March may be headed for a bigger-than-expected slide.
“The US economy shifted down a gear in March,” the chief business economist at Markit Economics said last week. “A slowing in the pace of growth signalled by the PMI surveys for a second straight month suggests that the economy is struggling to sustain momentum.”

US: Construction (1400 GMT): Bubbly sentiment data suggests that the economic outlook remains bright for the US, but some economists note that the hard numbers are still playing catch-up. Today’s report on construction spending for February is expected to help close the gap.
The crowd’s looking for a 1% bounce-back in the February monthly comparison following a decline of the same magnitude in January, according to TradingEconomics.com’s consensus forecast. The implied one-year change through February is 3.0%, or just slightly below January’s 3.1% rise.
A continuation of the modest annual rise that we’ve seen in recent months is good news in the sense that it foreshadows ongoing economic growth. At the same time, today’s projection remains well below what’s needed to provide clear support for the rosy forecasts that are inspired by expectations that the Trump administration’s policies will deliver materially stronger growth.
It’s too soon to judge the new president’s economic track record, least of all by using construction data for Trump’s first full month in the White House. Nonetheless, it’s interesting to note that the January decline in construction spending was largely due to a pullback by government expenditures, which have been declining in year-over-year terms for most of the past 12 months. Private residential construction spending, by contrast, firmed up in January, rising to the highest level in dollar terms since 2007.
One question to consider for today’s update: Will the government remain a headwind for stronger construction outlays in February?

Disclosure: Originally published at Saxo Bank TradingFloor.com
