When influential managers (e.g., large financial institutions, hedge funds, etc.) borrow low-yielding assets to invest in higher-appreciating, higher-yielding ones, they are engaging in a speculative art. What is the nature of the artwork here in 2014? Borrow as much yen and euro at negligible rates as possible to finance the acquisition of U.S. stocks and U.S. government bonds.
The “carry trade” works as a mechanism for buying U.S. stocks as long as the U.S. Federal Reserve remains committed to its zero percent rate policy and foreign central banks aim toward even larger-scale stimulative efforts (e.g., asset purchases, electronic currency creation, etc.). The carry trade also works for acquiring U.S. treasuries. If you can borrow the yen and the euro for a song, why wouldn’t you purchase dollar-denominated government debt that yields more than comparable Japanese government bonds or German bunds?
Of course, retail investors do not need to use leverage to pick up the assets that benefit from carry trading. ETF enthusiasts may simply purchase iShares S&P 500 (ARCA:IVV) and Vanguard Long-Term Bond (ARCA:BLV). Yet there’s a dark side to the precarious practice that can decimate your holdings just the same; that is, interconnecting forces can cause the process to reverse itself or “unwind.”
For instance, weak demand for oil around the world is a significant blow to Russia. Vladamir Putin relies heavily on oil revenue to service his country’s debt. If oil drops much further than the $70-$80 per barrel range, Russia might witness a debt crisis not unlike the sovereign debt crisis that Europe experienced in 2011. A spike in Russia’s debt yields could even lead to contagion across Europe. In other words, oil price deflation may seem like a great thing at the American gas pump, but it might cause a rapid exodus from U.S. stocks to pay back the borrowed yen and euro loans. Leverage works great until it’s time to “deleverage.”
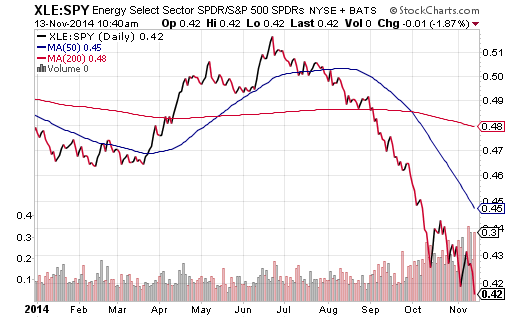
It follows that few trends are as important right now as the relative strength of the energy sector. You can track its progress via the SPDR Select Sector Energy (XLE):S&P 500 price ratio. A rising ratio would likely indicate a belief in the stabilization of oil prices and/or a stabilization of global demand. Ongoing deterioration of this price ratio could be a nasty harbinger of “risk-off” selling in the broader equity markets.
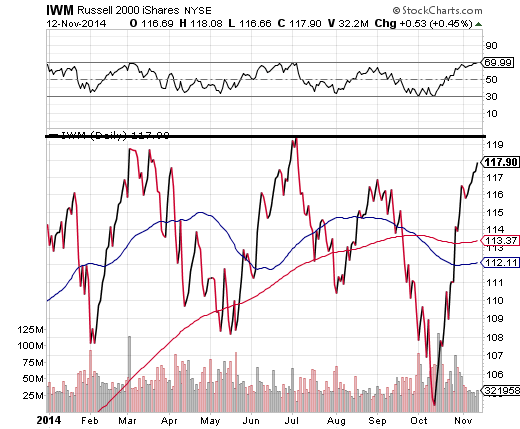
Another trend that requires vigilance is the desire (or lack thereof) for small-cap stocks. The “James Bullard bounce” that began on October 16 helped small-caps as much as any asset class. Yet suggesting that one’s Federal Reserve colleagues keep the quantitative easing door open is not the same as lowering rates or buying more bonds with electronically created dollars. It remains to be seen if small-caps will once again weaken, roll over and create consternation in the minds of carry traders and institutional money managers.
One method for staying abreast of small-cap stock direction? Watch for a technical break-out in iShares Russell 2000 (ARCA:IWM). If it cannot surpass the levels that it reached in March and July of this year, one would have to question the resilience of the small cap space. It is also worth noting that the Relative Strength Index (RSI) reading for IWM bumped up against 70 in March and July, then proceeded to sell off in dramatic fashion. At present, IWM is bumping up against an RSI of 70 once again.
In the previous decade, stock-market success corresponded to a weak U.S. dollar. One of the big reasons? Roughly one-third of S&P 500 corporate profits came from overseas. The appreciation in foreign currencies helped to supercharge earnings. Today, 40% to 50% of S&P 500 profits may be attributable to faster-growing emerging markets as well as developed foreign economies. The implication? The surge in the dollar adversely affects both U.S. exports as well as the overseas component of corporate earnings.
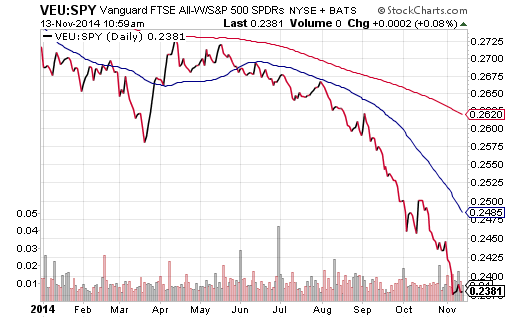
What might you watch for? Take a look at the price ratio for Vanguard FTSE All World ex U.S. (ASX:VEU) with the never-say-die SPDR S&P 500 Trust (ARCA:SPY). If VEU:SPY stabilizes or rises, one would have to feel better about the U.S. bull market’s prospects. If VEU:SPY continues to deteriorate, however, I would expect the U.S. bull market to falter.


