Presumably, the Great Recession ended in June of 2009. Three months earlier on March 9, the stock market anticipated the modest recovery that is still intact. In essence, stocks began to rally well in advance of the actual turnaround in the U.S. economy.
Similarly, the 10/09/2002-10/09/2007 bull market ended roughly three months before the start of the mammoth economic collapse (12/2007). In a sense, stock barometers were (and are) leading indicators of things to come.
For those who wish to believe that stocks will avoid a 20%-plus bearish setback on a combination of monetary policy gamesmanship and perceived economic strength, they might want to consider the history of recessions as well as the history of central bank stimulus. With some 50-odd contractions over the last 225 years, one should expect expansions to falter, on average, every four-and-a-half years. The current recovery? Five-and-a-half and counting. It is also worth noting that past recessions required the U.S. Federal Reserve to lower overnight lending rates by 3%-4% to combat recessionary forces. Even if the Fed manages to get the Fed Funds rate up to 0.5% in 2015 – even if policymakers succeed in pushing it up to a “whopping” 1% in 2016 – wouldn’t they have to return to 0% and more quantitative easing (QE) when the inevitable economic contraction returns?
Central bank QE as well as zero percent interest rates (ZIRP) have lowered the costs to service higher household and government debts; they have increased the rewards for risk-taking in real estate as well as as market-based securities. Yet these policies have not done a great deal to assure prosperity, as median household income is lower than it was in the heart of the Great Recession. Equally troubling, survey stand-out Gallup determined that business closings have exceeded the number of new businesses created each year since 2008. According to some analysts, the opening/closing business data may even be responsible for the Bureau of Labor Statistics (BLS) overstating job growth by as much as 600,000 jobs annually.
Nevertheless, the Fed explains that it is serious about raising interest rates in 2015. Stock bulls used to relish this type of optimism, particularly with respect to jobs. (You might want to ask the workers at (NYSE:SLB), (NYSE:IBM), Haliburton, (NYSE:AXP) and U.S. Steel if they share the sentiment.) And then there is the reality that inflation has remained below its 2% target for 30-plus months. Janet Yellen’s Fed expressed confidence that in spite of the failure of QE3 and ZIRP to influence rising prices, those rising prices should gradually reach the target of 2% in a tightening cycle. Really? Do investors even recognize that the Fed projected far greater economic growth than has actually occurred in every single year since 2008? Knowing that, why would anyone have confidence in a Fed expectation of 2% inflation?
There are perhaps three investment themes that make sense at this point in the late stage U.S. bull market. First, the entire globe is in the process of stimulating economic growth through conventional and/or unconventional measures. Why fight their central banks? As bond yields around the world continue moving lower, the activity only makes longer-term, dollar-denominated debt more attractive. If you want to buy the proverbial dips, you should probably be buying the bond dips on relative value. Consider iShares Lehman 10-20 Yr. Tr. Bond (NYSE:TLH), Vanguard Long Term Bond (ARCA:BLV) and closed-end muni fund like Nuveen Muni Opportunity (NIO).
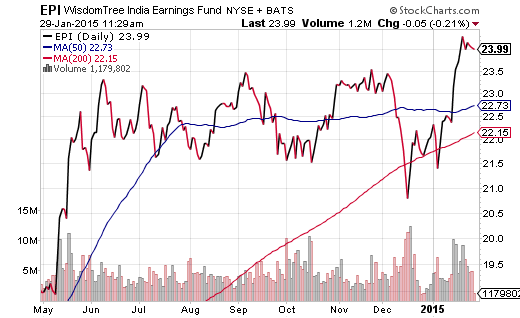
The second theme involves buying stimulus-driven stock ETFs. WisdomTree India (NYSE:EPI) has been a tremendous beneficiary of its own country’s unexpected rate cut activity, while iShares Currency Hedged Germany (HEWG) should benefit from the markedly lower euro and the negligible German bund yields that push investors into German equities.
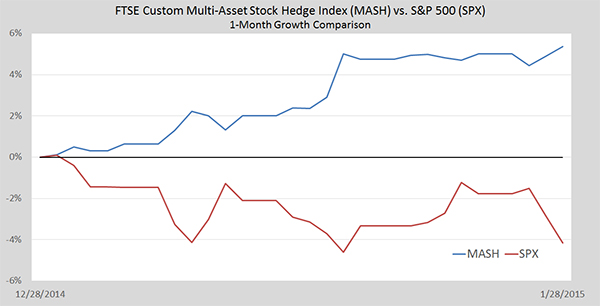
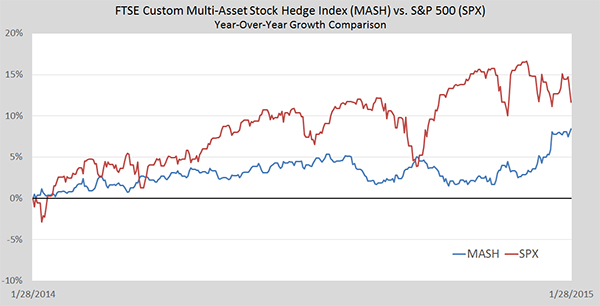
Third, investors should continue to hold prominent U.S. equity ETFs for as long as they are still working for them. I still maintain an allegiance to SPDR - Health Care (ARCA:XLV), iShares USA Minimum Volatility (NYSE:USMV) as well as Vanguard High Dividend Yield (NYSE:VYM). If any of these positions break below a 200-day moving average, however, I would insure against further depreciation by selling the position or increasing exposure to the index that my colleague and I created, the FTSE Custom Mutli-Asset Stock Hedge Index. One can already see the benefits of multi-asset stock hedging over 1 months, 3 months, 6 months and 1 year, where the combination of certain currencies, commodities, foreign sovereign debt and U.S. bonds are achieving desirable results.


