:
All of the Biotech companies mentioned below have have reported falling inventory turnover ratios.
Average Weekly Returns:
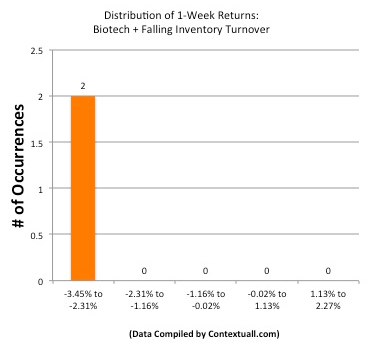
Average 1-Week Return of All Stocks Mentioned Below: -1.22%
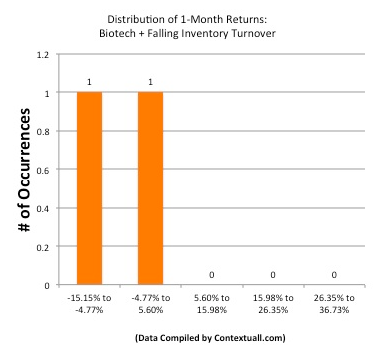
Average 1-Month Return of All Stocks Mentioned Below: 8.23%
Analysis of List Alpha:
Number of Stocks in This List Generating Excess Return vs. SP500 (Beta Adjusted Over Last Week): 1 out of 3 (33.33%)
Number of Stocks in This List Generating Excess Return vs. SP500 (Beta Adjusted Over Last Month): 2 out of 3 (66.67%)
Chart: Distribution of 1-Week Returns For All Stocks Mentioned Below 
Chart: Distribution of 1-Month Returns For All Stocks Mentioned Below
1. Albany Molecular Research Inc. (AMRI): Provides contract services to various pharmaceutical and biotechnology companies primarily in the United States, Europe, and Asia. Size of inventory grew by 31.90% during the most recent quarter ($33.16M vs. $25.14M y/y), while revenue only increased by 11.03% ($55.77M vs. $50.23M y/y). Inventory, as a percentage of current assets, increased from 22.18% to 30.88% during the most recent quarter (time interval comparison 3 months ending 2012-09-30 to 3 months ending 2011-09-30).
2. Gilead Sciences Inc. (GILD): Engages in the discovery, development, and commercialization of therapeutics for the treatment of life threatening diseases worldwide. Size of inventory grew by 20.90% during the most recent quarter ($1,617.37M vs. $1,337.75M y/y), while revenue only increased by 14.37% ($2,426.6M vs. $2,121.66M y/y). Inventory, as a percentage of current assets, increased from 21.76% to 27.5% during the most recent quarter (time interval comparison 3 months ending 2012-09-30 to 3 months ending 2011-09-30).
3. CEL-SCI Corp. (CVM): Engages in the research and development of drugs and vaccines. Size of inventory grew by -13.29% during the most recent quarter ($1.37M vs. $1.58M y/y), while revenue only increased by -50.0% ($0.04M vs. $0.08M y/y). Inventory, as a percentage of current assets, increased from 10.15% to 12.4% during the most recent quarter (time interval comparison 3 months ending 2012-06-30 to 3 months ending 2011-06-30).
Original post
- English (UK)
- English (India)
- English (Canada)
- English (Australia)
- English (South Africa)
- English (Philippines)
- English (Nigeria)
- Deutsch
- Español (España)
- Español (México)
- Français
- Italiano
- Nederlands
- Português (Portugal)
- Polski
- Português (Brasil)
- Русский
- Türkçe
- العربية
- Ελληνικά
- Svenska
- Suomi
- עברית
- 日本語
- 한국어
- 简体中文
- 繁體中文
- Bahasa Indonesia
- Bahasa Melayu
- ไทย
- Tiếng Việt
- हिंदी
3 Biotech Stocks With Falling Inventory Turnover Ratios
Published 12/14/2012, 03:21 AM
Updated 07/09/2023, 06:31 AM
3 Biotech Stocks With Falling Inventory Turnover Ratios
Screen Criteria
3rd party Ad. Not an offer or recommendation by Investing.com. See disclosure here or
remove ads
.
Latest comments
Install Our App
Risk Disclosure: Trading in financial instruments and/or cryptocurrencies involves high risks including the risk of losing some, or all, of your investment amount, and may not be suitable for all investors. Prices of cryptocurrencies are extremely volatile and may be affected by external factors such as financial, regulatory or political events. Trading on margin increases the financial risks.
Before deciding to trade in financial instrument or cryptocurrencies you should be fully informed of the risks and costs associated with trading the financial markets, carefully consider your investment objectives, level of experience, and risk appetite, and seek professional advice where needed.
Fusion Media would like to remind you that the data contained in this website is not necessarily real-time nor accurate. The data and prices on the website are not necessarily provided by any market or exchange, but may be provided by market makers, and so prices may not be accurate and may differ from the actual price at any given market, meaning prices are indicative and not appropriate for trading purposes. Fusion Media and any provider of the data contained in this website will not accept liability for any loss or damage as a result of your trading, or your reliance on the information contained within this website.
It is prohibited to use, store, reproduce, display, modify, transmit or distribute the data contained in this website without the explicit prior written permission of Fusion Media and/or the data provider. All intellectual property rights are reserved by the providers and/or the exchange providing the data contained in this website.
Fusion Media may be compensated by the advertisers that appear on the website, based on your interaction with the advertisements or advertisers.
© 2007-2024 - Fusion Media Limited. All Rights Reserved.
