Sometimes you stumble across a sector of the market that is just in the right place at the right time. That may very well be the sentiment driving the remarkable price action in aerospace and defense stocks in the current geopolitical environment. These companies are the driving forces behind military and commercial aircraft, defense equipment, and other services designed to support the armed forces.
The largest and most well-known exchange-traded fund that tracks this group is the iShares US Aerospace & Defense (NYSE:ITA). This passively managed index fund has $2.9 billion dedicated to a short list of just 39 large-cap stocks including: Boeing (NYSE:BA), United Technologies Corp (NYSE:UTX), and Lockheed Martin Corp (NYSE:LMT).
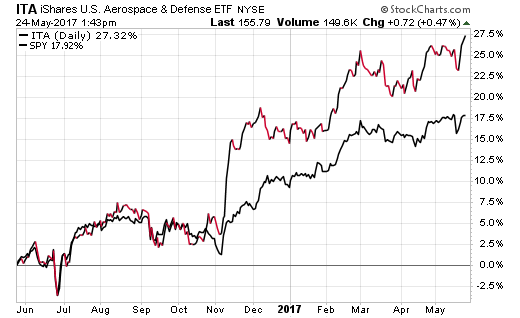
ITA just recently hit new all-time highs and is significantly outperforming the broader SPDR S&P 500 ETF (NYSE:SPY) over the last twelve months. The chart below shows just how sharply ITA took off after the 2016 election results as the expectation of additional military spending lurked on the horizon.

Another established fund in this class is the PowerShares Aerospace & Defense (NYSE:PPA). This ETF tales a slightly broader approach to its index construction criteria by including 52 defense stocks. Many of the top holdings are similar to that of ITA, although there is greater differentiation in the bottom quartile of the portfolio. This will likely only produce small variations in performance over longer cycles.
It is worth noting that PPA charges a modestly higher expense ratio of 0.64% versus 0.44% in ITA. Cost is becoming an ever more important consideration when investors compare similar passively managed ETFs. Unless a higher cost fund offers a distinctively unique strategy or enhanced liquidity, its likely to have diminished utility over the long-term.
The cheapest fund in this group is the youngest entrant in the SPDR S&P Aerospace & Defense ETF (NYSE:XAR). This ETF debuted in 2011 and offers a different approach to the weighting of its constituents. The 38 underlying holdings are derived from the aerospace & defense category of the S&P Total Market Index and equal weighted across the board. This provides smaller companies with a greater share of the fund’s assets and allows them to contribute meaningfully to performance. XAR also charges the lowest expense ratio of its peers at just 0.35%.
The Bottom Line
ETFs that track defense stocks tend to be more aggressive and potentially more volatile than the broader market based on their concentrated portfolios. Investors that are considering these tools should opt to take smaller, tactical positions compared to a traditional core holding with wider diversification and minimal expenses.
It also goes without saying that politics and global military trends are likely to have the biggest impact on the direction of these ETFs over the next several years.
