
I love high-quality dividend growth stocks and the stocks with the longest history of consecutive payments are definitely Dividend Kings and Dividend Champions. But the big disadvantage to them is that they are also highly priced. You cannot expect a great return with stocks that have a P/E ratio of 22 and grow by only 5 percent. You need real bargains to make a big profit.
Therefore, today I'm screening for the dividend growth stocks that have a beta ratio between 0.18 and 0.55. All three top picks come from the oil & gas pipeline industry, a branch with very stable sales and future growth perspectives due to the shale gas boom in the United States.
Among the 20 safest Dividend Challengers, nine stocks have a current buy or better rating.
Randgold Resources (GOLD) has a market capitalization of $5.72 billion. The company employs 2,048 people, generates revenue of $1.317 billion and has a net income of $510.78 million. The firm’s earnings before interest, taxes, depreciation and amortization (EBITDA) amounts to $697.88 million. The EBITDA margin is 52.96 percent (the operating margin is 43.06 percent and the net profit margin 38.76 percent).
Financial Analysis: The total debt represents 0.58 percent of the company’s assets and the total debt in relation to the equity amounts to 0.69 percent. Due to the financial situation, a return on equity of 17.95 percent was realized. Twelve trailing months earnings per share reached a value of $4.65. Last fiscal year, the company paid $0.50 in the form of dividends to shareholders. Forward P/E: 9.71.
Market Valuation: Here are the price ratios of the company: The P/E ratio is 13.34, the P/S ratio is 4.32 and the P/B ratio is finally 2.18. The dividend yield amounts to 0.81 percent and the beta ratio has a value of 0.55.
China Mobile (CHL) has a market capitalization of $203.25 billion. The company employs 182,487 people, generates revenue of $91.141 billion and has a net income of $21.041 billion. The firm’s earnings before interest, taxes, depreciation and amortization (EBITDA) amounts to $41.350 billion. The EBITDA margin is 45.37 percent (the operating margin is 26.86 percent and the net profit margin 23.09 percent).
Financial Analysis: The total debt represents 0.48 percent of the company’s assets and the total debt in relation to the equity amounts to 0.70 percent. Due to the financial situation, a return on equity of 18.84 percent was realized. Twelve trailing months earnings per share reached a value of $5.17. Last fiscal year, the company paid $2.77 in the form of dividends to shareholders. Forward P/E: 10.20.
Market Valuation: Here are the price ratios of the company: The P/E ratio is 9.78, the P/S ratio is 2.21 and the P/B ratio is finally 1.73. The dividend yield amounts to 4.35 percent and the beta ratio has a value of 0.35.
The Hanover Insurance Group (THG) has a market capitalization of $2.14 billion. The company employs 5,100 people, generates revenue of $4.590 billion and has a net income of $46.10 million. The firm’s earnings before interest, taxes, depreciation and amortization (EBITDA) amounts to $1.069 billion. The EBITDA margin is 23.29 percent (the operating margin is 0.63 percent and the net profit margin 1.00 percent).
Financial Analysis: The total debt represents 6.30 percent of the company’s assets and the total debt in relation to the equity amounts to 32.73 percent. Due to the financial situation, a return on equity of 1.82 percent was realized. Twelve trailing months earnings per share reached a value of $1.34. Last fiscal year, the company paid $1.23 in the form of dividends to shareholders. Forward P/E: 10.84.
Market Valuation: Here are the price ratios of the company: The P/E ratio is 36.13, the P/S ratio is 0.47 and the P/B ratio is finally 0.83. The dividend yield amounts to 2.72 percent and the beta ratio has a value of 0.55.
Take a closer look at the full list of the safest dividend growth stocks with five to 10 years of consecutive dividend growth. The average P/E ratio amounts to 26.33 and forward P/E ratio is 16.64. The dividend yield has a value of 4.07 percent. Price to book ratio is 2.98 and price to sales ratio 3.77. The operating margin amounts to 27.08 percent and the beta ratio is 0.40. Stocks from the list have an average debt to equity ratio of 1.26.
Here is the full table with some fundamentals (TTM): 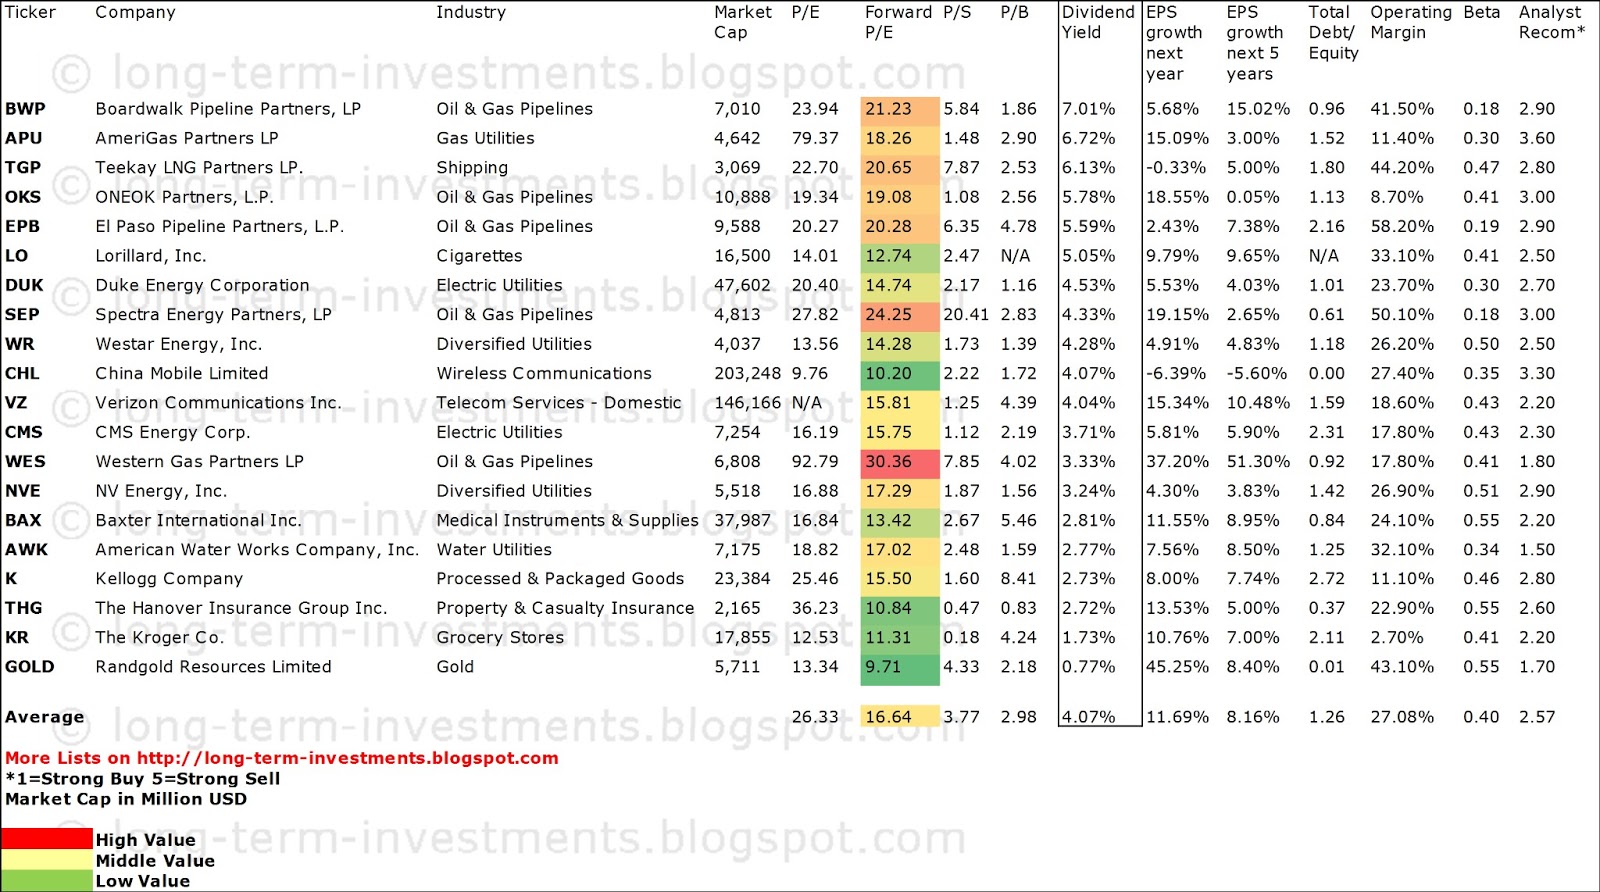
Related stock ticker symbols:
BWP, APU, TGP, OKS, EPB, LO, DUK, SEP, WR, CHL, VZ, CMS, WES, NVE, BAX,
AWK, K, THG, KR, GOLD
Disclosure: I am long LO, BAX, K. I receive no compensation to write about these specific stocks, sector or theme. I don't plan to increase or decrease positions or obligations within the next 72 hours.
For the other stocks: I have no positions in any stocks mentioned, and no plans to initiate any positions within the next 72 hours. I receive no compensation to write about any specific stock, sector or theme.
- English (UK)
- English (India)
- English (Canada)
- English (Australia)
- English (South Africa)
- English (Philippines)
- English (Nigeria)
- Deutsch
- Español (España)
- Español (México)
- Français
- Italiano
- Nederlands
- Português (Portugal)
- Polski
- Português (Brasil)
- Русский
- Türkçe
- العربية
- Ελληνικά
- Svenska
- Suomi
- עברית
- 日本語
- 한국어
- 简体中文
- 繁體中文
- Bahasa Indonesia
- Bahasa Melayu
- ไทย
- Tiếng Việt
- हिंदी
20 Of The Safest Dividend Challengers On The Market
Published 06/28/2013, 07:03 AM
20 Of The Safest Dividend Challengers On The Market
3rd party Ad. Not an offer or recommendation by Investing.com. See disclosure here or
remove ads
.
Latest comments
Install Our App
Risk Disclosure: Trading in financial instruments and/or cryptocurrencies involves high risks including the risk of losing some, or all, of your investment amount, and may not be suitable for all investors. Prices of cryptocurrencies are extremely volatile and may be affected by external factors such as financial, regulatory or political events. Trading on margin increases the financial risks.
Before deciding to trade in financial instrument or cryptocurrencies you should be fully informed of the risks and costs associated with trading the financial markets, carefully consider your investment objectives, level of experience, and risk appetite, and seek professional advice where needed.
Fusion Media would like to remind you that the data contained in this website is not necessarily real-time nor accurate. The data and prices on the website are not necessarily provided by any market or exchange, but may be provided by market makers, and so prices may not be accurate and may differ from the actual price at any given market, meaning prices are indicative and not appropriate for trading purposes. Fusion Media and any provider of the data contained in this website will not accept liability for any loss or damage as a result of your trading, or your reliance on the information contained within this website.
It is prohibited to use, store, reproduce, display, modify, transmit or distribute the data contained in this website without the explicit prior written permission of Fusion Media and/or the data provider. All intellectual property rights are reserved by the providers and/or the exchange providing the data contained in this website.
Fusion Media may be compensated by the advertisers that appear on the website, based on your interaction with the advertisements or advertisers.
© 2007-2024 - Fusion Media Limited. All Rights Reserved.