
The summer season is now here and the list of dividend growers shrinks to new lows. Last week, only 9 companies and three funds announced a dividend hike. Only four of them have a current buy or better rating. The average dividend growth of the top dividend growers from last week amounts to 13.29 percent.
Darden Restaurants (DRI) has a market capitalization of $6.89 billion. The company employs 181,468 people, generates revenue of $8.552 billion and has a net income of $412.60 million. The firm’s earnings before interest, taxes, depreciation and amortization (EBITDA) amounts to $1.043 billion. The EBITDA margin is 12.20 percent (the operating margin is 6.11 percent and the net profit margin 4.82 percent).
Financial Analysis: The total debt represents 39.11 percent of the company’s assets and the total debt in relation to the equity amounts to 131.74 percent. Due to the financial situation, a return on equity of 21.15 percent was realized. Twelve trailing months earnings per share reached a value of $3.13. Last fiscal year, the company paid $2.0 in the form of dividends to shareholders. DRI announced a 10.0 percent dividend hike last week.
Market Valuation: Here are the price ratios of the company: The P/E ratio is 16.10, the P/S ratio is 0.77 and the P/B ratio is finally 3.34. The dividend yield amounts to 4.36 percent and the beta ratio has a value of 0.87.
Duke Energy (DUK) has a market capitalization of $47.66 billion. The company employs 27,885 people, generates revenue of $19.624 billion and has a net income of $1.746 billion. The firm’s earnings before interest, taxes, depreciation and amortization (EBITDA) amounts to $6.621 billion. The EBITDA margin is 33.74 percent (the operating margin is 15.85 percent and the net profit margin 8.90 percent).
Financial Analysis: The total debt represents 35.59 percent of the company’s assets and the total debt in relation to the equity amounts to 99.16 percent. Due to the financial situation, a return on equity of 5.44 percent was realized. Twelve trailing months earnings per share reached a value of $3.31. Last fiscal year, the company paid $3.03 in the form of dividends to shareholders. DUK announced a 2.0 percent dividend hike last week.
Market Valuation: Here are the price ratios of the company: The P/E ratio is 20.39, the P/S ratio is 2.43 and the P/B ratio is finally 1.16. The dividend yield amounts to 4.62 percent and the beta ratio has a value of 0.30.
Glacier Bancorp (GBCI) has a market capitalization of $1.60 billion. The company employs 1,677 people, generates revenue of $253.76 million and has a net income of $75.52 million. The firm’s earnings before interest, taxes, depreciation and amortization (EBITDA) amounts to $129.94 million. The EBITDA margin is 51.21 percent (the operating margin is 30.56 percent and the net profit margin 24.40 percent).
Financial Analysis: The total debt represents 5.49 percent of the company’s assets and the total debt in relation to the equity amounts to 47.17 percent. Due to the financial situation, a return on equity of 8.62 percent was realized. Twelve trailing months earnings per share reached a value of $1.11. Last fiscal year, the company paid $0.53 in the form of dividends to shareholders. GBCI announced a 7.1 percent dividend hike last week.
Market Valuation: Here are the price ratios of the company: The P/E ratio is 19.97, the P/S ratio is 5.16 and the P/B ratio is finally 1.77. The dividend yield amounts to 2.70 percent and the beta ratio has a value of 0.94.
Worthington Industries (WOR) has a market capitalization of $2.23 billion. The company employs 10,500 people, generates revenue of $2.534 billion and has a net income of $125.35 million. The firm’s earnings before interest, taxes, depreciation and amortization (EBITDA) amounts to $163.67 million. The EBITDA margin is 6.46 percent (the operating margin is 4.01 percent and the net profit margin 4.95 percent).
Financial Analysis: The total debt represents 28.42 percent of the company’s assets and the total debt in relation to the equity amounts to 76.55 percent. Due to the financial situation, a return on equity of 16.67 percent was realized. Twelve trailing months earnings per share reached a value of $2.21. Last fiscal year, the company paid $0.48 in the form of dividends to shareholders. WOR announced a 15.4 percent dividend hike last week.
Market Valuation: Here are the price ratios of the company: The P/E ratio is 14.37, the P/S ratio is 0.89 and the P/B ratio is finally 3.09. The dividend yield amounts to 1.89 percent and the beta ratio has a value of 1.61.
Take a closer look at the full table of stocks with recent dividend hikes. The average dividend growth amounts to 13.29 percent and the average dividend yield amounts to 4.81 percent. Stocks from the sheet are valuated with a P/E ratio of 17.62. The average P/S ratio is 7.45 and P/B 1.97.
Here is the full list of the latest dividend growth stocks: 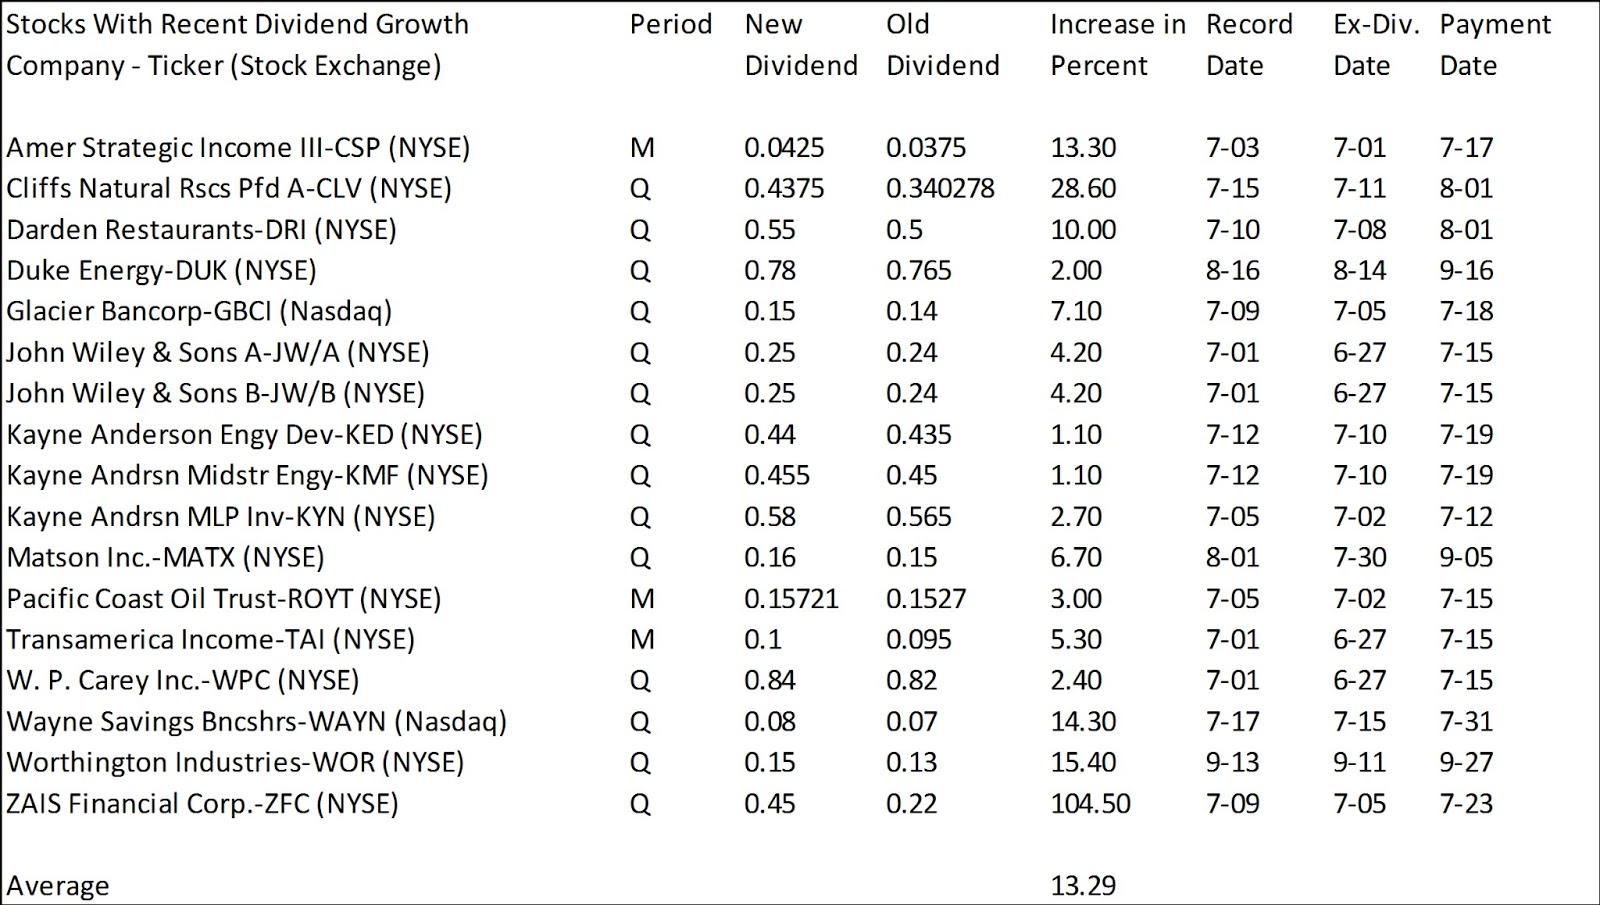

Related Stock Ticker:
CSP, CLV, DRI, DUK, GBCI, JWA, KED, KMF, KYN, MATX, ROYT, TAI, WPC, WAYN,
WOR, ZFC,
- English (UK)
- English (India)
- English (Canada)
- English (Australia)
- English (South Africa)
- English (Philippines)
- English (Nigeria)
- Deutsch
- Español (España)
- Español (México)
- Français
- Italiano
- Nederlands
- Português (Portugal)
- Polski
- Português (Brasil)
- Русский
- Türkçe
- العربية
- Ελληνικά
- Svenska
- Suomi
- עברית
- 日本語
- 한국어
- 简体中文
- 繁體中文
- Bahasa Indonesia
- Bahasa Melayu
- ไทย
- Tiếng Việt
- हिंदी
12 Stocks And Funds With Recent Dividend Growth
Published 06/30/2013, 04:20 AM
Updated 07/09/2023, 06:31 AM
12 Stocks And Funds With Recent Dividend Growth
3rd party Ad. Not an offer or recommendation by Investing.com. See disclosure here or
remove ads
.
Latest comments
Install Our App
Risk Disclosure: Trading in financial instruments and/or cryptocurrencies involves high risks including the risk of losing some, or all, of your investment amount, and may not be suitable for all investors. Prices of cryptocurrencies are extremely volatile and may be affected by external factors such as financial, regulatory or political events. Trading on margin increases the financial risks.
Before deciding to trade in financial instrument or cryptocurrencies you should be fully informed of the risks and costs associated with trading the financial markets, carefully consider your investment objectives, level of experience, and risk appetite, and seek professional advice where needed.
Fusion Media would like to remind you that the data contained in this website is not necessarily real-time nor accurate. The data and prices on the website are not necessarily provided by any market or exchange, but may be provided by market makers, and so prices may not be accurate and may differ from the actual price at any given market, meaning prices are indicative and not appropriate for trading purposes. Fusion Media and any provider of the data contained in this website will not accept liability for any loss or damage as a result of your trading, or your reliance on the information contained within this website.
It is prohibited to use, store, reproduce, display, modify, transmit or distribute the data contained in this website without the explicit prior written permission of Fusion Media and/or the data provider. All intellectual property rights are reserved by the providers and/or the exchange providing the data contained in this website.
Fusion Media may be compensated by the advertisers that appear on the website, based on your interaction with the advertisements or advertisers.
© 2007-2024 - Fusion Media Limited. All Rights Reserved.