: 34.9%
VIX Status: 20.1
General (Short-term) Trading Call: Hold with bearish hedges
Commentary:
The churn continues as my “firm bullishness” from two days ago quickly turns into increased caution. This period was so brief, I barely had a chance to expand my short-term bullish positions -- I added a handful of JKS shares to my SSO shares and Siemens call options -- and I instead find myself with more bearish ones, mainly in the form of more VXX call options and shares.
T2108 was crushed on Thursday, dropping from 52% to 35% (directly above the 50DMA for T2108). The S&P 500 dropped 2.2%, placing it below its 50DMA again and erasing my earlier bullishness. Note well that this sharp drop is what I would normally expect for the index to work off extremely overbought stochastics. If the index remains healthy, it will bounce back quickly. I am not optimistic in the short-term given the drop below the important support now turned resistance again at the 50-DMA.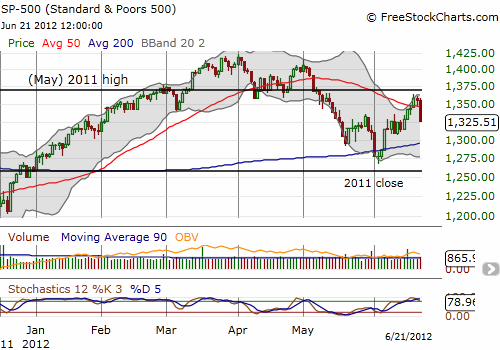
Note how the S&P 500 also fell below the previous resistance formed by the highs following May’s oversold period. The index will need to re-fight its way if it bounces from here. Ultimately, we should watch to see whether a trading range sustains itself between the 2011 high (in May) and the 2011 close.
As I expected, volatility was crushed after the Fed announcement, but on Thursday it soared as if it was responding to pent-up demand. The VIX is now again knocking on the door of the critical 21 level.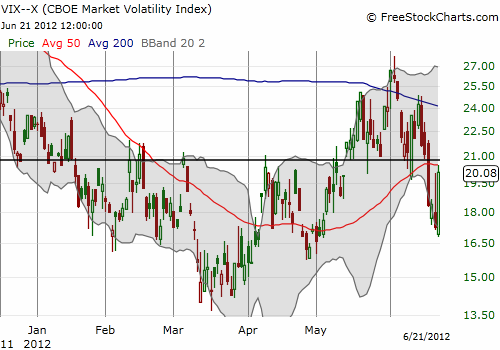
This all adds up to a likely increase in risk aversion. The Australian dollar further confirms the flee from risk. The currency plunged against the U.S. dollar and almost dropped back to parity after a very strong run. It maintained perfect resistance at the 2010/2011 close.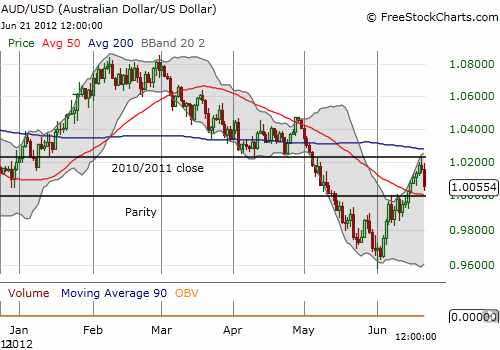
At this point, a lot of caution is warranted. The S&P 500 has to climb above 50-DMA resistance yet again for me to throw some caution to the wind. Even then, the additional resistance of the May highs from 2011 and 2012 await. Otherwise, I wait for another oversold reading.
Finally, note that the cyclical indicator in Caterpillar (CAT) continues to flash red. The stock never benefited much from the previous rally, it remains negative for the year, and it has been unable to challenge that resistance since late May. CAT also had another sales report and analyst presentation this week that failed to impress the market.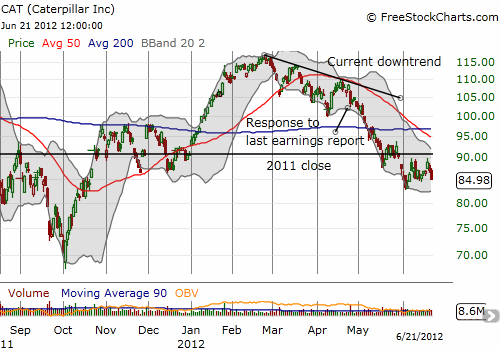
Daily T2108 vs the S&P 500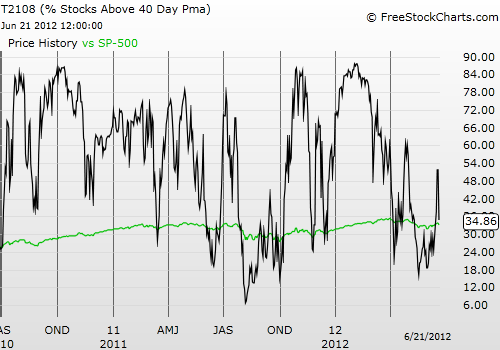
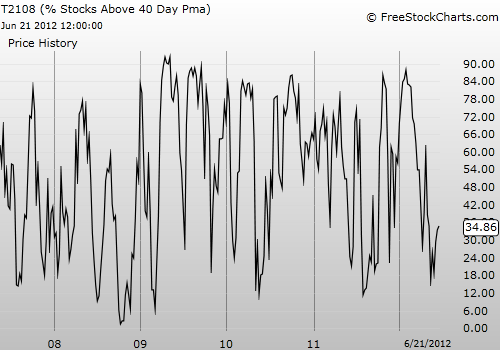
Be careful out there!
Full disclosure: long SDS, SSO; long VXX calls, puts, and shares; long SI calls; long CAT, long JKS
- English (UK)
- English (India)
- English (Canada)
- English (Australia)
- English (South Africa)
- English (Philippines)
- English (Nigeria)
- Deutsch
- Español (España)
- Español (México)
- Français
- Italiano
- Nederlands
- Português (Portugal)
- Polski
- Português (Brasil)
- Русский
- Türkçe
- العربية
- Ελληνικά
- Svenska
- Suomi
- עברית
- 日本語
- 한국어
- 简体中文
- 繁體中文
- Bahasa Indonesia
- Bahasa Melayu
- ไทย
- Tiếng Việt
- हिंदी
'Risk-On' Prevails As Churn Returns
Published 06/22/2012, 08:37 AM
Updated 07/09/2023, 06:31 AM
'Risk-On' Prevails As Churn Returns
T2108 Status
Latest comments
Loading next article…
Install Our App
Risk Disclosure: Trading in financial instruments and/or cryptocurrencies involves high risks including the risk of losing some, or all, of your investment amount, and may not be suitable for all investors. Prices of cryptocurrencies are extremely volatile and may be affected by external factors such as financial, regulatory or political events. Trading on margin increases the financial risks.
Before deciding to trade in financial instrument or cryptocurrencies you should be fully informed of the risks and costs associated with trading the financial markets, carefully consider your investment objectives, level of experience, and risk appetite, and seek professional advice where needed.
Fusion Media would like to remind you that the data contained in this website is not necessarily real-time nor accurate. The data and prices on the website are not necessarily provided by any market or exchange, but may be provided by market makers, and so prices may not be accurate and may differ from the actual price at any given market, meaning prices are indicative and not appropriate for trading purposes. Fusion Media and any provider of the data contained in this website will not accept liability for any loss or damage as a result of your trading, or your reliance on the information contained within this website.
It is prohibited to use, store, reproduce, display, modify, transmit or distribute the data contained in this website without the explicit prior written permission of Fusion Media and/or the data provider. All intellectual property rights are reserved by the providers and/or the exchange providing the data contained in this website.
Fusion Media may be compensated by the advertisers that appear on the website, based on your interaction with the advertisements or advertisers.
© 2007-2024 - Fusion Media Limited. All Rights Reserved.
