🔮 Better than the Oracle? Our Fair Value found this +42% bagger 5 months before Buffett bought itRead More

SUNE: Collapse In Focus

Published 08/12/2015, 06:15 AM
Updated 07/09/2023, 06:31 AM
SUNEQ
-

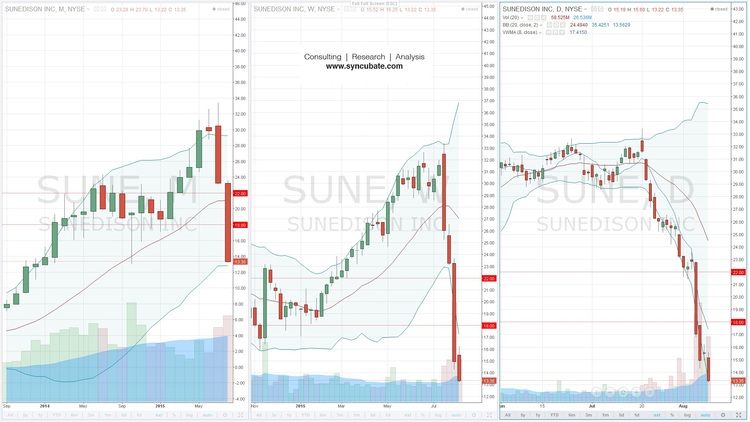
Sunedison Inc (NYSE:SUNE) has taken a steep nose dive on persistent selling pressure since the end of July. The chart below, which displays the monthly, weekly and daily time frames for comparison, makes that stark reality evident as the stock has lost ten-months worth of gains in less than a month!

SUNE Monthy, Weekly And Daily Chart

Let's just focus on the volume for a moment. There are just over 315 million common shares outstanding for SUNE; yesterday alone, 58.5 million shares changed hands—nearly three times the average daily trading volume of 20 million shares. Last Thursday and Friday combined, a total of over 150 million shares changed hands. This is truly a jaw dropping collapse on extreme bearish sentiment.

On July 20th, 2015, just over three weeks ago, SUNE traded as high as $33.45. Yesterday, SUNE closed at $13.35, representing an over $20 fall since the recent high. There are various fundamental reasons for this sell off, but I won't go into them since I'd like to focus on the chart and price action.

SUNE is currently trading below its lower Bollinger Band® on the daily and weekly time frames. Should support be found at the lower Bollinger Band on the monthly chart, currently just under $13, then a dead cat bounce rally is favorable. This remains to be seen, however, so catching a falling knife is not advised.

The high turnover in shares is what truly piqued my interest, keeping in mind the number of shares outstanding. Assuming the selling pressure abates soon, a snap back rally could be quite the eye opener. I am noting the $18 and $22 levels as resistance areas to watch based off of historical congestion zones on the monthly and weekly charts.

Obviously, $18 would be the first level to focus on, assuming the bulls can regroup and get SUNE back above $15 for a push higher towards $16 with supporting volume. The 8-day volume weighted moving average currently sits at $17.41.

Latest comments

Loading next article…
Risk Disclosure: Trading in financial instruments and/or cryptocurrencies involves high risks including the risk of losing some, or all, of your investment amount, and may not be suitable for all investors. Prices of cryptocurrencies are extremely volatile and may be affected by external factors such as financial, regulatory or political events. Trading on margin increases the financial risks.
Before deciding to trade in financial instrument or cryptocurrencies you should be fully informed of the risks and costs associated with trading the financial markets, carefully consider your investment objectives, level of experience, and risk appetite, and seek professional advice where needed.
Fusion Media would like to remind you that the data contained in this website is not necessarily real-time nor accurate. The data and prices on the website are not necessarily provided by any market or exchange, but may be provided by market makers, and so prices may not be accurate and may differ from the actual price at any given market, meaning prices are indicative and not appropriate for trading purposes. Fusion Media and any provider of the data contained in this website will not accept liability for any loss or damage as a result of your trading, or your reliance on the information contained within this website.
It is prohibited to use, store, reproduce, display, modify, transmit or distribute the data contained in this website without the explicit prior written permission of Fusion Media and/or the data provider. All intellectual property rights are reserved by the providers and/or the exchange providing the data contained in this website.
Fusion Media may be compensated by the advertisers that appear on the website, based on your interaction with the advertisements or advertisers.
© 2007-2024 - Fusion Media Limited. All Rights Reserved.