


Sign up to create alerts for Instruments,
Economic Events and content by followed authors
Free Sign Up Already have an account? Sign In
Please try another search
Knowing the right time to buy or sell a stock can be a million dollar question. As a retail investor, you’re familiar with the process of vetting a potential investment, but when it comes to decision time - you worry whether you’re paying too much or selling too low.
While there are plenty of models suggesting a possible fair value price of a specific stock, they are usually complex and difficult to access. How can you be sure whether or not to trust a model if you don’t have clarity on what’s inside the “black box”, determining your potential trade decision if a stock is undervalued or overvalued?
InvestingPro’s Fair Value, a tool designed to estimate the true worth of a stock, removes the complexity that often clouds last-mile decisions before making an investment and is part of our long-term mission to empower retail investors. Whether you just want to quickly know a stock’s current fair value or double-click into the details and specifications of how it works - it’s your easy, transparent way to achieve objective insights into the enduring question: "Should I buy this stock now? Should I sell it?"
Let’s start with a recent example of our Fair Value in action:
Qualcomm (NASDAQ:QCOM) is a global company that focuses on creating and selling essential technologies for the wireless industry. On November 4, 2022, Qualcomm's market price was at $106.69. At that time, InvestingPro's Fair Value highlighted that the stock was undervalued and had an upside of +65.27%, indicating a potential stock price of $171.68. This suggested that it was an excellent opportunity to invest.
Fast forward to April 16, 2024, and Qualcomm's stock price had surged +62.73% to $173.62, closely aligning with our estimates. And QCOM is just one of many examples of stocks that have realized their potential and provided substantial returns for their investors.
A common industry benchmark for fair value suggests that it typically takes 12 to 18 months for the market to correct any discrepancies in their estimation, so the example above takes the same time frame to see how the stock price reacted.
But …how does it work?
Using established and industry-wide stock valuation methods, InvestingPro’s Fair Value tool provides you with the most comprehensive and accurate fair value estimates in the market for determining a stock’s intrinsic value.
Our conclusion of the fair value of each stock is based on a simple average of a mix of 17 evaluation models that are rooted in three basic approaches: Discounted Cash Flow (DCF), Comparable Company Analysis Models, and Dividend Models.

But first let’s understand the different model categories:
1. Discounted Cash Flow (DCF) is a valuation method that equates a company's worth to the present value of its future cash flows. It allows investors to assess the attractiveness of an investment opportunity by considering the expected returns relative to the current market price. Comparing the concept of fair value in stocks to buying a house, the value of a company can be determined by how much cash flow (profit) it can generate, similar to how much rent you could collect from a property.
There are different DCF models due to varying ways to analyze future cash flows - such as based on revenue, growth, or EBITDA - and different time frames to consider like 5 years or 10 years.
Our Fair Value also uses the Earnings Power Value model, which is similar to DCF models but based on historical data and doesn’t rely as much on forecasts.
2. Comparable Company Analysis Models (also known as Multiplier models) involve taking a certain financial metric, like earnings or revenue, and multiplying it by a relevant factor to arrive at a valuation. These multiples provide a quick way to assess the relative valuation of a company compared to its peers or the broader market. If you think a company is about to be acquired and want to gain an understanding of how much it might be worth under new ownership, you could use this model to help you make that estimate.
For example, Microsoft acquired LinkedIn for $26.2 billion in 2016. At the time of the acquisition, LinkedIn's revenue was approximately $3 billion, which implies an EV/Revenue multiple of around 8.7x.
InvestingPro’s Fair Value usually chooses the relevant peers for you, but let’s say you want to look at TSLA in terms of car company valuations and not as tech company valuations. You’d probably want to remove Virgin Galactic, Amazon, and Apple; and change the peers to companies like Toyota (TM), Volkswagen (VWAGY), and Nio (NIO). Try Tesla’s benchmark editor.

3. The Dividend Discount Model (DDM) is a method of valuing a company's stock by using predicted dividends and discounting them back to present value. It's based on the premise that a stock is worth the present value of all its future dividends. There are two main versions of the DDM: the Stable Growth DDM (which assumes that dividends will continue to grow at a constant rate indefinitely) and the more complex Multi-Stage DDM (which allows for different growth rates at different stages in the company's life).
The settings of each of the 17 models in the categories above are fully transparent: You can see exactly how it’s been calculated, customize the model’s settings to your own needs, and even export the model to your own Excel file for offline work.
Transparency Builds Confidence
Each model is validated for each stock, and in cases where we can’t validate that assumptions are correct, the model in question is automatically removed so you get reliable values.
Some sectors can’t be evaluated by certain models, and InvestingPro’s Fair Value matches the relevant models to the relevant companies. For example, banks can’t be evaluated by the DCF model due to their unique cash flow operation. Another industry that stands out is Real Estate Investment Trusts (REITs). They use a unique fair value model based on Price to Funds From Operations (P/FFO) Multiples. An example of this can be seen in Prologis , Inc. (NYSE:PLD).
To help you build confidence and trust in using Fair Value, each result is accompanied by an uncertainty level, based on a mix of considerations such as the company’s price volatility, profitability, and the number of available models.

If one of the 17 models provides an extremely significant different price from the market (for instance, a price that is 100% above the current market price or 60% below it), it may be excluded from our Fair Value analysis due to low reliability. However, these models are still made available for you to enable it again per your choice. Another reason a Fair Value model may not be displayed is due to insufficient data. This often occurs with companies that have recently undergone an Initial Public Offering (IPO) and have yet to publish their financial reports.
The easy-to-read interface and data-driven insights make it incredibly effective for safeguarding retail investors from buying high and selling low. You’ll understand exactly how we arrive at our calculations so you can review the models and adjust them to your needs. Playing with the inputs (highlighted in blue) can give you a better understanding of your expected projections and risk tolerance.

Getting the Most Value from InvestingPro’s Fair Value
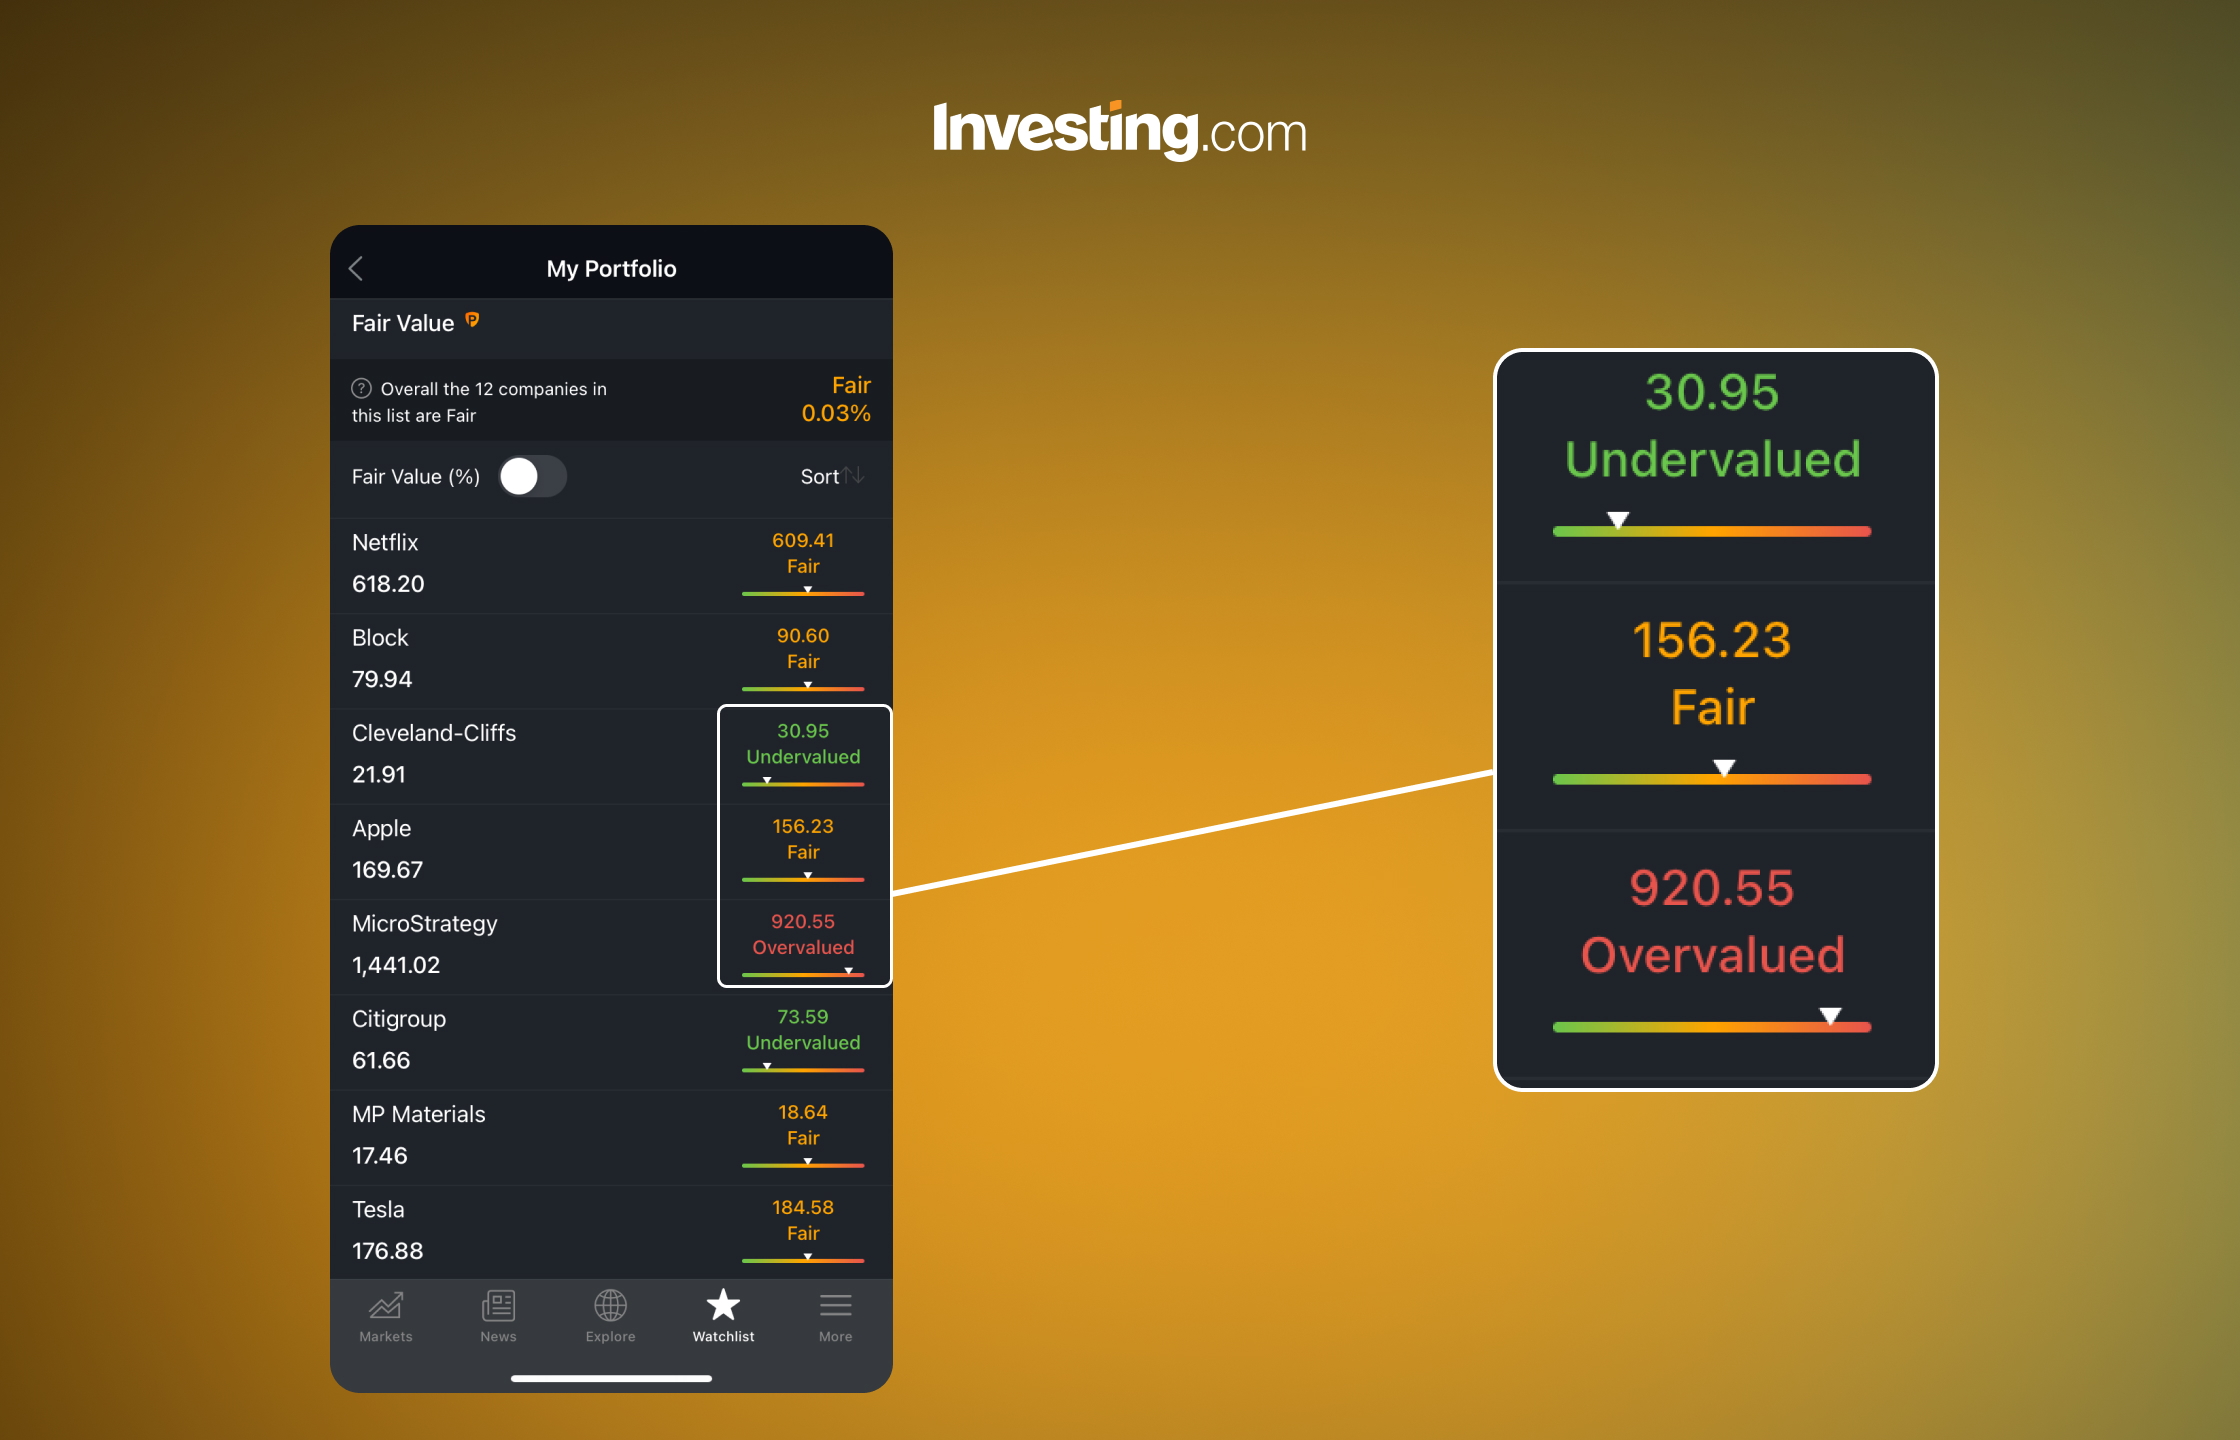
One of the most common uses for our Fair Value is to monitor stocks in your Watchlist to know if and when they become undervalued or overvalued. Just add the stocks in which you’re interested to your dedicated list so you never experience avoidable losses or missed gains again.
Another popular use case is to discover new undervalued stocks with which you may not be familiar. Use our preset Strong Upside screener to explore stocks with great market opportunity of +10-100% upside, looking at their current market price versus their Fair Value estimation.
“Time constraints often prevent close monitoring of individual stock performance, leaving investors vulnerable to avoidable losses. Our Fair Value tool offers a solution—a quick, reliable, big-picture overview into the Fair Value of a stock. With this tool, investors gain immediate insights into whether a stock is undervalued, overvalued, or fairly priced, empowering them to make informed decisions without the need for constant monitoring.” Andy Pai, VP Subscriptions X at Investing.com
The Bottom Line
Whether you're looking for investment opportunities or just to monitor your portfolio health, InvestingPro’s Fair Value helps you know the right time to buy or sell, minimizing the risk of avoidable losses and maximizing potential gains.
Access Fair Value on both the Investing.com website and the Investing.com mobile app, with additional full access to all insights that are part of InvestingPro. Subscribe now
Are you sure you want to block %USER_NAME%?
By doing so, you and %USER_NAME% will not be able to see any of each other's Investing.com's posts.
%USER_NAME% was successfully added to your Block List
Since you’ve just unblocked this person, you must wait 48 hours before renewing the block.
I feel that this comment is:
Thank You!
Your report has been sent to our moderators for review
Add a Comment
We encourage you to use comments to engage with other users, share your perspective and ask questions of authors and each other. However, in order to maintain the high level of discourse we’ve all come to value and expect, please keep the following criteria in mind:
Enrich the conversation, don’t trash it.
Stay focused and on track. Only post material that’s relevant to the topic being discussed.
Be respectful. Even negative opinions can be framed positively and diplomatically. Avoid profanity, slander or personal attacks directed at an author or another user. Racism, sexism and other forms of discrimination will not be tolerated.
Perpetrators of spam or abuse will be deleted from the site and prohibited from future registration at Investing.com’s discretion.