Free Cash Flow (FCF) is more than just a financial term — it’s the lifeblood of any successful business. It offers a clear snapshot of a company’s financial well-being, serving as an essential tool for investors, business leaders, and financial analysts.
From evaluating a company’s ability to cover its expenses and invest in growth, to gauging its attractiveness as an investment, Free Cash Flow provides a comprehensive view of financial health and strategic potential.
What is Free Cash Flow?
Free cash flow is the definitive measure of a company’s financial health, representing the cash left after meeting both operational expenses and capital investments. This metric stands as a financial reality check, focusing strictly on cash, which is the ultimate indicator of financial solidity.
The allocation of FCF reveals a company’s strategic objectives. For instance, using FCF for dividends suggests a shareholder-centric approach, while reinvestment indicates growth ambitions. In either case, how a company uses its free cash flow can provide crucial insights into its long-term vision and financial stability.
For investors, a consistent generation of strong FCF makes a company an attractive investment option, signaling its capability to self-finance growth and deliver shareholder value.

What is the Free Cash Flow Formula?
The formula to calculate free cash flow is relatively straightforward:
Free Cash Flow (FCF) = Operating Cash Flow − Capital Expenditures
Here, Operating Cash Flow refers to the cash generated from regular business activities, while Capital Expenditures encompass the costs incurred for long-term investments, such as machinery or real estate.

How to Calculate Free Cash Flow?
The process of calculating Free Cash Flow (FCF) involves a detailed examination of a company’s financial statements. It is a straightforward process but requires attention to detail.
Let’s break it down step by step:
Step 1: Identify Operating Cash Flow
The first step is to locate the Operating Cash Flow on the company’s Cash Flow Statement. This figure represents the cash generated from the company’s regular business operations. You can get this information directly from a company’s quarterly or annual reports. These reports are publicly available online, or you can request a mailed copy.
Step 2: Spot Capital Expenditures
The next step is to identify the Capital Expenditures, which can also be found on the Cash Flow Statement, usually listed under the section titled ‘Investing Activities’. Capital Expenditures refer to the funds spent by the company on acquiring or maintaining fixed assets, such as property, buildings, or equipment.
Step 3: Calculate Free Cash Flow
Finally, subtract the Capital Expenditures from the Operating Cash Flow. The result is the Free Cash Flow, which represents the cash available to the company after paying for its operational expenses and long-term investments.
For example, if a company has an Operating Cash Flow of $100,000 and Capital Expenditures of $20,000, the calculation would be as follows:
Free Cash Flow (FCF)=$100,000−$20,000=$80,000
So, the Free Cash Flow for the company would be $80,000.
InvestingPro+: Access Free Cash Flow Data Instantly
Unlock Premium Data With InvestingPro+ 📈💸
Gain instant access to free cash flow data within the InvestingPro+ platform. Plus:
✓ Access to 1200+ additional fundamental metrics
✓ Competitor comparison tools
✓ Evaluate stocks with 14+ proven financial models
What Does Free Cash Flow Tell Us?
Free Cash Flow (FCF) is a critical financial indicator that provides a comprehensive view of a company’s financial health.
Profitability
A positive FCF indicates that the company is generating sufficient revenue to cover its operational and capital expenses. This surplus of cash is a strong indicator of the company’s profitability. It reflects the company’s ability to generate surplus cash from its core operations, which is essential for sustaining growth and providing returns to shareholders.
Liquidity
Liquidity refers to the company’s ability to meet its short-term obligations. A high FCF suggests that the company has adequate cash resources to cover its immediate liabilities. This financial flexibility is crucial for a company to navigate through unexpected challenges and take advantage of strategic opportunities.
Growth Prospects
When a company has a surplus of FCF, it has the financial capacity to reinvest in new projects or ventures that promise higher returns in the future. This reinvestment potential is a positive indicator of the company’s growth prospects. It signifies that the company is well-positioned to capitalize on new opportunities and create value for its shareholders.
How To Find the Free Cash Flow Ratio
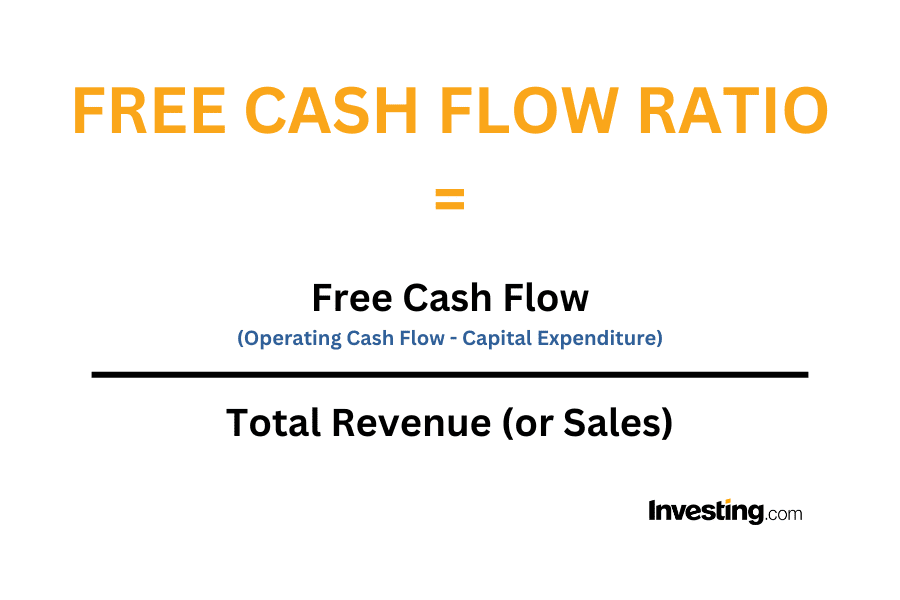
Once you have calculated a company’s free cash flow, the next step is to find the free cash flow ratio. This is a simple process, as outlined in the step by step below:
Step 1: Find the Free Cash Flow (FCF)
Start by locating a company’s free cash flow figure in its financial reports. This information is what we worked out earlier in this article.
Step 2: Identify the Total Revenue or Sales
Look for the company’s total revenue or sales for the same period as the free cash flow figure. You can usually find this information in the company’s income statement.
Step 3: Perform the Calculation
Take the Free Cash Flow (from Step 1) and divide it by the Total Revenue or Sales (from Step 2).

Step 4: Interpret the Result
The number you get from Step 3 is the Free Cash Flow Ratio. A higher FCF Ratio indicates that the company is generating more cash relative to its revenue. This can be a positive sign for investors as it suggests the company is efficiently converting sales into actual cash profits.
Step 5: Consider Implications
Analyze the FCF Ratio in the context of the company’s industry and financial goals. A high or improving FCF Ratio may suggest strong financial health, while a declining ratio might warrant further investigation.
What is a Good Free Cash Flow Ratio?
Defining a “good” FCF ratio isn’t as simple as pointing to a single number. While a ratio above 1 is generally a positive indicator across industries, the benchmark for what constitutes a ‘good’ ratio can differ significantly depending on the sector.
As a starting point, a Free Cash Flow ratio above 1 is considered favorable for any company. This implies that the business is generating enough cash to more than cover its operating expenses and investments, a key indicator of financial health. It’s like earning more money than you spend on bills and groceries; it leaves you with options and a sense of financial security.
Sector-Specific Differences
Different industries have their own ‘good’ FCF ratio due to the unique challenges and costs they face:
Retail Sector: Here, a ratio above 1.2 is a strong sign. It means the company is financially healthy and could potentially open new stores or enhance existing ones.
Software Industry: A ratio above 1.5 is especially favorable in this sector. Software companies often spend a lot on research and development, so a higher ratio suggests they can afford these expenses while still being profitable.
Energy Sector: Companies here often have high costs for things like drilling and equipment, so a slightly lower ratio above 0.8 is still considered good.
Investor and Stakeholder Implications
So what does it all mean for investors and stakeholders? A strong Free Cash Flow ratio is generally seen as a favorable financial indicator, signaling a company’s ability to grow, reduce debt, or provide returns to shareholders. It often suggests competent management and makes the company an attractive investment opportunity.
On the other hand, a low Free Cash Flow ratio calls for caution. It could indicate operational inefficiencies or high capital expenditures, leading to potential liquidity risks. In such instances, comprehensive due diligence is advisable for investors and stakeholders.
It’s essential to view the Free Cash Flow ratio in the broader context of other financial metrics and market conditions. This nuanced approach allows for more informed decision-making regarding investment and risk assessment.
Free Cash Flow Ratio: The Bottom Line
Free Cash Flow (FCF) is a vital metric for assessing a company’s financial health, growth potential, and appeal to investors. A ‘good’ FCF ratio is more than just a number; it reveals important insights about a company’s operational efficiency, strategic opportunities, and financial stability. With a solid understanding of FCF, you can make well-informed, strategic decisions that impact your investments or business operations.
Frequently Asked Questions
Free Cash Flow is often considered a more reliable metric than EPS because it is harder to manipulate. It provides a transparent view of a company’s cash position, which is crucial for any investor.
How does seasonality impact Free Cash Flow?
Seasonal businesses may experience fluctuations in Free Cash Flow depending on the time of year. This is important to consider when analyzing FCF as these fluctuations could be mistaken for volatility or instability.
What are some red flags in Free Cash Flow?
Consistently declining or negative Free Cash Flow can be a red flag. It could indicate underlying issues such as decreasing revenues, increasing costs, or inefficient operations.
Is Free Cash Flow the same as Net Income?
No, Free Cash Flow and Net Income are not the same. Net Income includes various non-cash items and accounting adjustments, whereas Free Cash Flow focuses strictly on actual cash generated.
How does debt repayment factor into Free Cash Flow?
Debt repayment doesn’t directly affect the calculation of Free Cash Flow, but a company’s ability to service its debt is often evaluated in the context of its Free Cash Flow.
Can Free Cash Flow be negative for a successful company?
Yes, a successful company can have negative Free Cash Flow temporarily, especially if it’s making significant long-term investments. However, this isn’t sustainable in the long term.


