

The financial markets can often feel like a massive, churning ocean, unpredictable and driven by forces beyond your control. You may be proficient in fundamental analysis, knowing what a great company is, but still struggle with the crucial question of when to buy or sell. This is where Technical Charts Interpretation becomes your indispensable navigator.
Technical analysis is the study of past market data, primarily price and volume, to forecast future price direction. It operates on the simple, yet profound, idea that all known information—earnings reports, economic data, news events, and investor psychology—is already reflected in the stock’s price. The charts, therefore, are a visual language of market behavior.
This Technical Analysis Guide will walk you through a systematic, step by step process for reading stock charts. We will move beyond simply identifying shapes to building a cohesive, risk managed strategy. By the end of this guide, you will be equipped to decode the market’s language, spot high probability trading signals, and make smarter, more confident investment decisions.
The Ultimate Time Saver: Analyze Any Chart in 1 Click 📊⏱️
You understand the complexity involved in manually cross-referencing trends, RSI, MACD, and volume. You even understand the top stock chart patterns and how to interpret their bullish or bearish meanings. But the financial markets move so fast that every minute spent manually analyzing a chart is an opportunity lost.
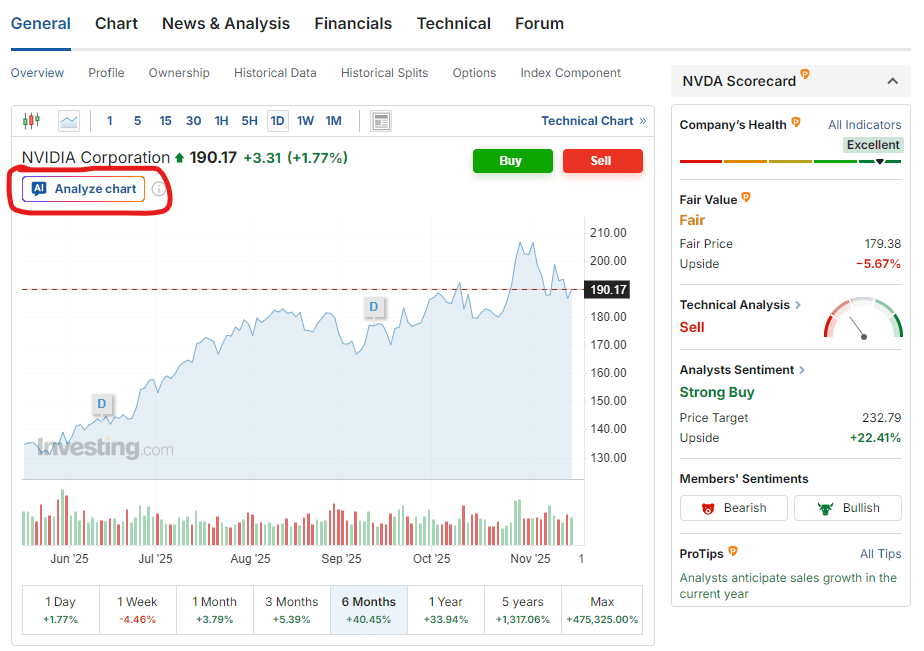
Investing.com’s exclusive WarrenAI tool cuts through the noise. Simply navigate to any stock, crypto, or commodity page on Investing.com and click ‘Analyze Chart’ button (as shown below).
Decoding the Language of Price: Foundational Steps to Read Stock Charts
Before you can interpret signals, you must first understand the visual representation of the market’s activity. The chart is the canvas, and price is the primary subject.
Understanding the Core Chart Types
While line charts are simple, showing only the closing price over time, the Candlestick chart is the bedrock of modern technical analysis. Each “candlestick” represents price action for a specific time period (e.g., one day, one hour).
- The Body: Shows the difference between the opening and closing price. A green or hollow body means the close was higher than the open (bullish), and a red or filled body means the close was lower than the open (bearish).
- The Wicks (Shadows): Represent the highest and lowest price reached during that period.
A single candlestick tells a powerful story of the battle between buyers and sellers. Did the price open low, shoot up high, but close in the middle? That’s a story of a battle with no clear winner, often indicating indecision. Learning to quickly read stock charts begins with understanding the core emotional struggle within these simple shapes.
The Power of Trading Volume Analysis
Price movement is important, but volume provides the conviction behind that move. Volume analysis tracks the total number of shares or contracts traded during a specific period, usually displayed as vertical bars at the bottom of the chart.
The Golden Rule: A large price move (up or down) accompanied by high volume is significantly more meaningful and reliable than the same move on low volume.
Practical Application: Imagine a stock price breaks above a previous high. If this breakout happens on low volume, it is a weak move—the “smart money” may not be participating, and the price is likely to fall back down. If the breakout occurs on massive volume, it signals strong institutional interest and greatly increases the probability of a sustained trend. Volume acts as a crucial confirmation filter.
The Battlefield of Price: Interpreting Support and Resistance
Every market move is a clash between supply (sellers) and demand (buyers). These battles often take place at key psychological and technical price boundaries known as Support and Resistance.
Defining Key Price Levels
- Support: A price level where buying interest is strong enough to overcome selling pressure, causing the price to stop falling and often bounce back up. It’s a price floor.
- Resistance: A price level where selling interest is strong enough to overcome buying pressure, causing the price to stop rising and often reverse. It’s a price ceiling.
The Principle of Polarity: A key principle is that when a strong resistance level is decisively broken, it often transforms into a new support level. Similarly, a broken support level often becomes new resistance. This flip in roles is a powerful signal of a sustained shift in market sentiment.
Using Support and Resistance for Entry and Exit
For a technical analyst, Support and Resistance levels are not just historical markers; they are actionable zones.
- Entry Strategy: A high probability entry point is often near a strong support level, as the risk of a significant drop is limited (the floor is close).
- Exit Strategy: Strong resistance levels are natural targets for selling, as the probability of a reversal increases there.
This brings us directly to risk management. The distance below a support level (or above a resistance level for short sellers) is the logical place to set a stop loss order. Why? Because if the price falls below the established floor (support), it signals that the market structure has changed, and your initial hypothesis is wrong.
By placing your stop there, you let the chart define your maximum risk, taking the emotion out of the decision.
Spotting the Signals: Essential Technical Indicators
While price and volume are raw data, technical indicators are mathematical formulas applied to that data to help clarify trend direction, momentum, and volatility. They serve as secondary, confirmatory signals.
Trend Confirmation with Moving Averages
Moving Averages (MAs) are the ultimate trend following tool. They smooth out price fluctuations (noise) to clearly show the prevailing trend direction. Two popular types are the Simple Moving Average (SMA) and the Exponential Moving Average (EMA), which places more weight on recent price action.
- Application: In an uptrend, the price will generally stay above the Moving Average (e.g., the 50 day or 200 day MA), and the MA itself will slope upward. The MA then acts as a dynamic support level.
- The Crossover: When a shorter term MA (e.g., 50 day) crosses above a longer term MA (e.g., 200 day), it is a powerful buy signal known as a “Golden Cross.” Conversely, a “Death Cross” (shorter term crossing below longer term) signals a potential shift to a downtrend.
Gauging Momentum with the Relative Strength Index (RSI)
The Relative Strength Index (RSI) is a momentum oscillator that measures the speed and change of price movements. Its purpose is to identify overbought and oversold conditions. The RSI oscillates between 0 and 100.
- Overbought: A reading above 70 suggests the price may have risen too quickly and a pullback or reversal is imminent.
- Oversold: A reading below 30 suggests the price may have dropped too far and a bounce is likely.
Caution: While RSI signals are helpful, they are not always sufficient on their own. In a very strong uptrend, the RSI can remain above 70 for extended periods—the stock is not necessarily about to crash, it is just very strong. Always use RSI in conjunction with trend direction (Moving Averages) and key price levels (Support and Resistance).
Reading the Market’s Map: Key Chart Patterns
Markets are driven by human psychology, and because investor emotions are timeless, certain price formations tend to repeat themselves, creating key chart patterns. These patterns offer a potential roadmap for the future direction of the market.
Reversal Patterns
The Head and Shoulders Pattern is one of the most reliable reversal patterns, signaling a shift from an uptrend to a downtrend (or vice versa with an inverse pattern). It consists of three peaks: a higher middle peak (the head) and two lower peaks on either side (the shoulders).
The key signal comes when the price breaks below the neckline (the support line connecting the low points). This break often predicts a drop equal to the height of the “head.”
Continuation Patterns
Triangle Patterns (Ascending, Descending, and Symmetrical) are continuation patterns that typically form during a pause in the existing trend. They represent a period of consolidation where volume usually decreases.
The subsequent breakout from the triangle, usually in the direction of the original trend and on high volume, signals that the market is ready to resume its movement.
The Final Strategy: Combining Indicators and Managing Risk
A beginner often falls into the trap of using a dozen indicators, only to suffer from analysis paralysis when they inevitably contradict one another. The secret to effective Technical Charts Interpretation is not complexity, but confirmation.
The Rule of Confirmation: Avoiding Contradictory Signals
Never rely on a single indicator. A robust technical signal requires non contradictory evidence across different types of tools:
- Price Action: Is the price currently testing a major Support and Resistance level?
- Trend: Is the trend (validated by Moving Averages) aligned with your proposed trade direction?
- Momentum: Is the RSI indicating an extreme (overbought/oversold) that supports your reversal hypothesis, or is it simply confirming a strong, ongoing trend?
- Volume: Does the trading volume confirm the significance of the price move?
If your Moving Averages say “Buy” but the RSI is screaming “Overbought,” you have a non confirmation. In this scenario, the best move is often to do nothing or size your position much smaller, waiting for a clearer signal.
Integrating Stop Losses with Technical Levels
We must reiterate that technical analysis is about managing probabilities, not predicting the future. The chart not only tells you where to enter, but also precisely where you are wrong.
- For a long position (a buy trade), your stop loss should be placed just below the key support level that defined your entry.
- For a short position (a sell trade), your stop loss should be placed just above the resistance level that defined your entry.
By integrating the stop loss directly into your Technical Charts Interpretation strategy, you define your maximum risk before the trade begins, protecting your capital and ensuring your journey through the market is responsible and sustainable.
Conclusion
The process of reading stock charts is the foundation for systematic, confident investing. You have moved beyond viewing a chart as a random collection of lines to seeing it as the concise, objective record of market psychology.
By mastering the language of Candlestick Patterns, understanding the significance of Support and Resistance levels, and confirming your ideas with powerful tools like Moving Averages and the RSI, you gain a true edge.
Remember: the chart is always right, and the market is always changing. Your continuous practice in Technical Charts Interpretation is the only factor that will turn this Technical Analysis Guide from a reference into a profitable habit. Start applying these principles on a paper trading account today, and watch your confidence grow with every chart you analyze.
Institutional-Grade Analysis, Immediate Results 🔎⏱️
The market moves fast, so make sure your insights move faster. Access WarrenAI’s instant technical analysis alongside the full suite of InvestingPro tools, including proprietary fair value calculations, financial health scores and AI-powered ProPicks.
Unlike other AIs that only analyze numbers, WarrenAI indentifies visual patterns (candlestick formations, support levels, and trends) that make or break trades.
What WarrenAI Does Instantly: 🤖
🔎 Technical Summary: Provides a plain-language analysis of the current market structure, including trend, momentum, and key S/R levels.
⚠️ Risk Identification: Points out potential downside risks or failed signals the chart is flashing.
💡 Opportunity Spotlight: Highlights confirmed buy/sell signals based on institutional-grade algorithms, giving you a definitive edge.
🗺️ Trading Plan: Receive specific entry, stop-loss, and profit target prices based on technical analysis and risk/reward calculations that spot opportunities humans often miss.
Stop wasting time doing everything manually. Leverage WarrenAI to gain an instant edge to trade any market – across crypto, forex, commodities, stocks, ETFs and indices. Capture opportunities wherever they emerge, filtering hours of analysis into a concise, actionable report.
Don’t get left behind. Start your InvestingPro membership today.


