As an investor, you’ve likely grappled with one of the most fundamental questions in the stock market: Is this trend real, or is it just a temporary fluctuation? The main trend of a stock is your guide, but price action alone can be misleading, creating “head fakes” that lead to poor decisions. This is where oscillators come in. These powerful technical analysis tools are not meant to predict the future, but rather to confirm the present, providing an essential second opinion on the strength and sustainability of a price move.
This article will serve as your comprehensive guide to using market oscillators effectively. We’ll demystify these indicators, explain how they act as confirmation tools, and show you practical, actionable ways to integrate them into your trading strategy.
By the end, you will understand how to harness the power of indicators like the Relative Strength Index (RSI) and Stochastic Oscillator to make more confident, trend confirming investment decisions.
What are Oscillators & Why are They Essential for Trend Confirmation?
An oscillator is a technical analysis tool that fluctuates or “oscillates” between a set minimum and maximum, typically plotted below a stock’s price chart. These indicators are crucial because they measure the momentum or rate of change in a stock’s price, helping you gauge the underlying health of a trend.
Think of an oscillator as the engine check light for a stock trend. The price trend might look good on the surface, but the oscillator shows you what’s happening under the hood. When a stock is clearly moving up, the oscillator provides a mathematical measure of the buying pressure and velocity of that move. This allows you to differentiate between a healthy, accelerating trend and a tired one that is about to reverse.
The Problem Solved: Separating Real Trends from Noise
The primary challenge in trading is avoiding false signals. Price action is often noisy and subject to short term emotional trading. A strong uptrend might experience a small, sudden dip that makes investors panic and sell, only for the rally to continue. Oscillators help solve this by providing a standardized, mathematical perspective on momentum.
A stock in a strong, sustained uptrend will typically see its oscillator remain in the higher range (but not necessarily overbought). Conversely, if the stock price is rising but the oscillator is failing to hit new high levels, it signals that the underlying momentum is weakening—a major red flag. This concept is called divergence, and it is one of the most powerful uses of an oscillator.
The Ultimate Time Saver: Analyze Any Chart in 1 Click 📊⏱️
You understand the complexity involved in manually cross-referencing trends, RSI, MACD, and volume. You even understand the top stock chart patterns and how to interpret their bullish or bearish meanings. But the financial markets move so fast that every minute spent manually analyzing a chart is an opportunity lost.
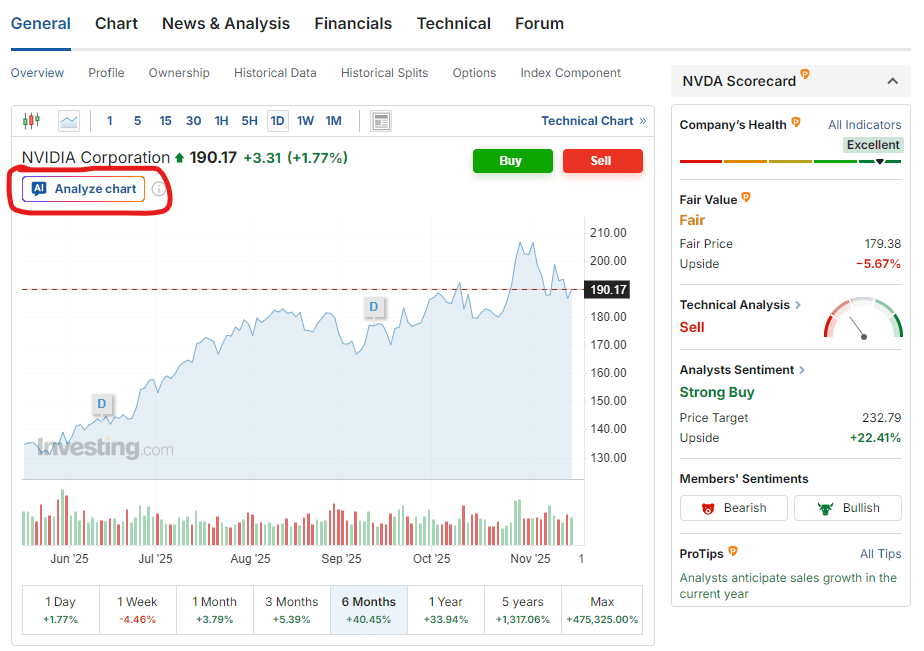
Investing.com’s exclusive WarrenAI tool cuts through the noise. Simply navigate to any stock, crypto, or commodity page on Investing.com and click ‘Analyze Chart’ button (as shown below).
Key Oscillators for Confirming Price Trends
While dozens of oscillators exist, a few are fundamental staples for investors focused on trend confirmation. Understanding how these tools work is crucial for effective technical analysis.
The Relative Strength Index (RSI)
The Relative Strength Index (RSI) is perhaps the most popular momentum oscillator. Developed by J. Welles Wilder, it measures the magnitude of recent price changes to evaluate overbought or oversold conditions. The RSI is plotted as a single line, fluctuating between 0 and 100.
| RSI Reading | Standard Interpretation | Trend Confirmation Use |
|---|---|---|
| Above 70 | Overbought | Confirmation of a STRONG trend, but be mindful of potential short term reversal risk. |
| Below 30 | Oversold | Confirmation of a strong downtrend, but be mindful of potential short term bounce. |
| 50 Level | Midpoint/Neutral | A decisive move above 50 confirms growing momentum in an uptrend, and vice versa. |
Practical Application: In a confirmed uptrend, you want to see the RSI stay comfortably above 40 during pullbacks. If the price is rallying and the RSI struggles to climb past 60, it suggests the trend is not as robust as the price action may imply, signaling a potential slowdown or reversal.
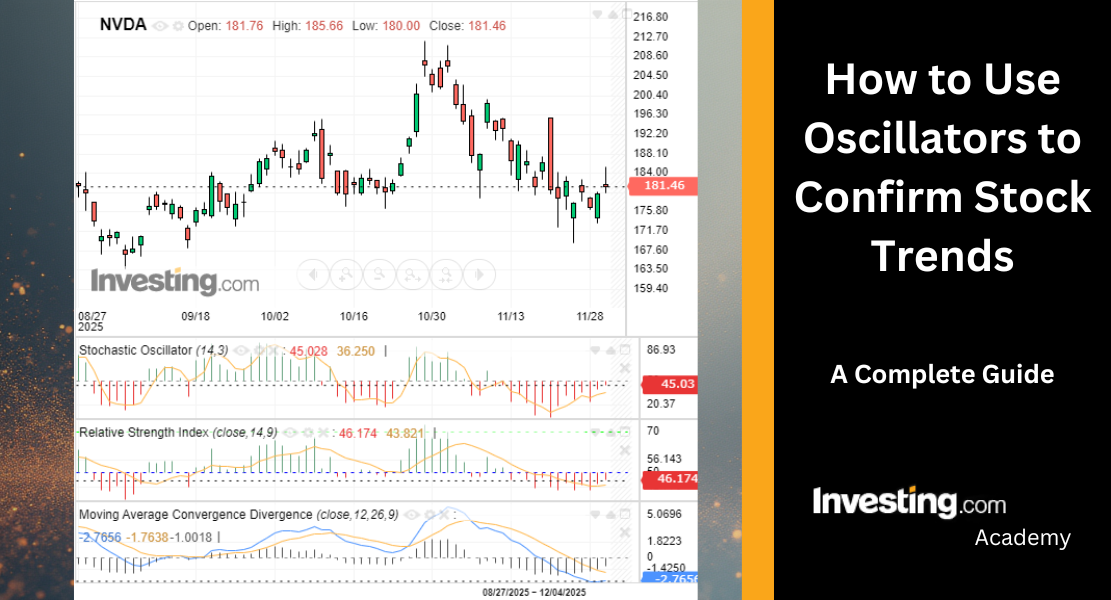
The Stochastic Oscillator
The Stochastic Oscillator measures the closing price of a security relative to its high/low range over a set period. Its core philosophy is that in a sustained uptrend, prices should close near the high end of the range, and in a downtrend, they should close near the low end. It consists of two lines:
- %K (the main line): The current momentum.
- %D (the signal line): A simple moving average of %K.
Practical Application: The Stochastic Oscillator is excellent for spotting potential short term tops and bottoms within a larger trend. For trend confirmation, look for the %K line to be above the %D line while both are in the mid-range (e.g., between 20 and 80) during an uptrend. If both lines rapidly cross below 20 and immediately cross back up, it confirms a strong trend just had a minor, temporary pause.
The Golden Rule: Confirmation Through Divergence
While using oscillators to identify overbought/oversold levels is a common practice, their most powerful application for trend confirmation is identifying divergence. Divergence occurs when the price of a stock and the oscillator move in opposite directions, acting as an early warning that the current trend is losing momentum and may be about to reverse.
This is the ultimate tool for avoiding costly trend reversals.
Bearish Divergence (Warning of a Downtrend)
- Scenario: The stock price makes a higher high.
- Oscillator Signal: The RSI or Stochastic makes a lower high.
- Interpretation: The rally is failing to generate the same level of buying momentum as the previous peak. The enthusiasm is waning, even as the price edges up. This is a strong warning sign that the uptrend is exhausted and a reversal is imminent.
Bullish Divergence (Warning of an Uptrend)
- Scenario: The stock price makes a lower low.
- Oscillator Signal: The RSI or Stochastic makes a higher low.
- Interpretation: While sellers have driven the price lower, the selling momentum (as measured by the oscillator) is not as strong as it was during the last low. This suggests selling pressure is drying up, and a reversal to the upside is likely.
Metaphor: Think of a car climbing a hill. The price (the car’s position) is still moving forward, but the oscillator (the engine’s RPM) is dropping. Divergence tells you the engine is sputtering, and the car may soon stall or roll back.
Validate the Warning: Check Financial Health Before You Exit 🩺📊
Divergence is warning you about a trend break. But is the company fundamentally collapsing, or just taking a breath?
Before you sell, use InvestingPro to check the stock’s Financial Health Score to confirm the risk. A “Weak” score validates the bearish divergence; a “Great” score suggests caution. Use fundamentals as your ultimate risk filter!

Integrating Oscillators into Your Trading Strategy
Confirming a trend with an oscillator is rarely a standalone signal; it is one piece of a broader risk management and analysis puzzle. Here is a step by step process for investors to implement this technique:
Step 1: Identify the Primary Trend
First, determine the long term direction of the stock using moving averages (like the 50 day and 200 day) or trendlines. Never use an oscillator signal against a major, confirmed trend unless you are looking for a short term countertrend trade. Our goal here is to confirm the main trend.
Step 2: Look for Oscillator Validation
Once a trend is identified (e.g., an uptrend), use your chosen oscillator (RSI or Stochastic) to confirm the momentum.
- Uptrend Validation: The oscillator should consistently hold above the 50 line (RSI) or remain in the upper-middle range, dipping only briefly into the lower ranges during temporary pullbacks.
- Downtrend Validation: The oscillator should consistently hold below the 50 line (RSI) or remain in the lower-middle range during brief price bounces.
Step 3: Hunt for Divergence as a Trend Exit Signal
When the price trend appears to be reaching an extreme, immediately check the oscillator for divergence. A clear bearish divergence in an uptrend should be your signal to trim your position or tighten your stop loss, as the trend’s foundation is crumbling.
This is not a signal to short the stock, but a signal to protect your gains and manage risk responsibly. Conversely, bullish divergence during a strong sell off can be a signal that a buying opportunity is emerging.
Risk Management: Balancing Confirmation with Caution
While oscillators are powerful tools for trend confirmation, they are not infallible. Historically, major investment bubbles show that a stock can remain “overbought” (RSI above 70) for extended periods in a powerful bull market. Relying solely on the RSI crossing 70 to sell a stock in an incredibly strong trend would mean missing out on significant further gains.
Constructive Strategy: Use the overbought/oversold readings not as sell or buy signals, but as alert signals.
- When a stock is overbought in a strong uptrend, it simply confirms that the buying pressure is high. You should only consider selling if this overbought condition is followed by a bearish divergence or a break of a major trendline.
- Conversely, a stock can remain oversold in a severe bear market for a long time. Wait for the oscillator to break out of the oversold zone (e.g., RSI crosses above 30) and confirm a bullish divergence before initiating a new buy position.
Conclusion
Mastering the use of oscillators to confirm stock trends is about moving beyond simply following the price and understanding the momentum driving it. The price action tells you where the stock has been, but the oscillator tells you how strong the engine is. By consistently pairing Moving Averages or Trendlines (to establish the major trend) with key indicators like the RSI and Stochastic Oscillator (to confirm the momentum), you introduce a powerful layer of objectivity into your decision making.
Remember the golden rule: Divergence is the market’s early warning system. It’s the essential signal that the underlying trend structure is breaking down, regardless of what the current price level suggests. While no single indicator guarantees success, integrating oscillators as a confirmation tool significantly enhances your ability to manage risk, protect profits, and distinguish between a genuine, healthy trend and a brief, misleading burst of volatility.
Start practicing by overlaying these tools on charts of stocks you already follow. This disciplined approach to technical analysis is your path to becoming a more confident and effective trend-following investor.
Institutional-Grade Analysis, Immediate Results 🔎⏱️
The market moves fast, so make sure your insights move faster. Access WarrenAI’s instant technical analysis alongside the full suite of InvestingPro tools, including proprietary fair value calculations, financial health scores and AI-powered ProPicks.
Unlike other AIs that only analyze numbers, WarrenAI identifies visual patterns (candlestick formations, support levels, and trends) that make or break trades.
What WarrenAI Does Instantly: 🤖
🔎 Technical Summary: Provides a plain-language analysis of the current market structure, including trend, momentum, and key S/R levels.
⚠️ Risk Identification: Points out potential downside risks or failed signals the chart is flashing.
💡 Opportunity Spotlight: Highlights confirmed buy/sell signals based on institutional-grade algorithms, giving you a definitive edge.
🗺️ Trading Plan: Receive specific entry, stop-loss, and profit target prices based on technical analysis and risk/reward calculations that spot opportunities humans often miss.
Stop wasting time doing everything manually. Leverage WarrenAI to gain an instant edge to trade any market – across crypto, forex, commodities, stocks, ETFs and indices. Capture opportunities wherever they emerge, filtering hours of analysis into a concise, actionable report.
Don’t get left behind. Start your InvestingPro membership today.