For many investors, following a strong trend is the most profitable path. But how often have you hesitated to jump into a rising stock, only to watch it climb higher without you? Conversely, how often have you entered a position only to see a minor pullback turn into a full reversal?
The problem is timing. Once a trend is established, the market’s movements often feel chaotic, making low risk entries feel impossible.
Hidden divergence is not a sign of trend reversal, as many assume. Instead, it is a powerful trend continuation signal that tells you: “The pullback is over, and the momentum is about to surge back in the direction of the main trend.” Think of it as the market’s secret language, confirming that a brief rest in price is actually a healthy pullback—the perfect time for a disciplined entry.
This guide will demystify this powerful concept, showing you how to spot hidden divergence using the right tools and how to transform it into a highly reliable hidden divergence trading strategy.
The term divergence simply means a disagreement between the price action of an asset and the reading of a technical momentum indicator. This disagreement is the market warning you that the underlying strength of the move is not what the price suggests.
The Crucial Difference: A Reversal vs A Continuation Signal
To unlock the power of hidden divergence, you must first clearly distinguish it from its more common cousin, regular divergence:
- Regular Divergence (The Reversal Signal): This signals trend exhaustion and potential reversal.
- Example: Price makes a new Higher High (HH), but the indicator makes a Lower High (LH). The price is rising, but the momentum is fading, warning of a potential crash.
- Hidden Divergence (The Continuation Signal): This signals trend resilience and probable continuation.
- Example: Price makes a Higher Low (HL), but the indicator makes a Lower Low (LL). The price is showing a minor dip (a pullback), but the indicator’s deeper dip suggests that the momentum is building strength for the next leg up.
Stop Missing Low-Risk Entries: Unlock Pro-Grade Charts & Indicators 📈
Hidden Divergence is the perfect entry signal, but it’s hard to spot on basic charts! Don’t rely on guesswork. The financial markets move so fast that every minute spent manually analyzing a chart is an opportunity lost.
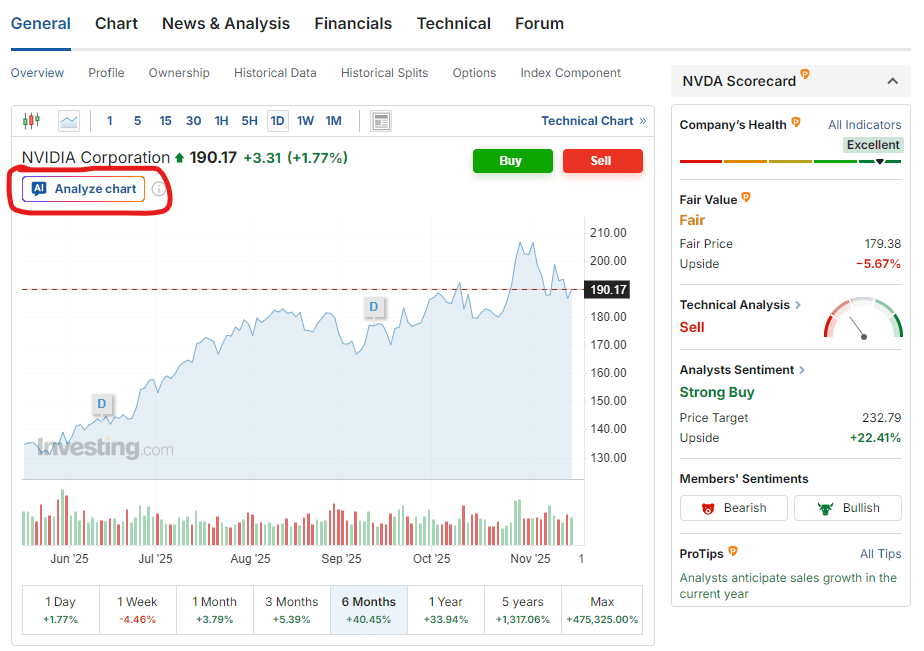
Investing.com’s exclusive WarrenAI tool cuts through the noise. Simply navigate to any stock, crypto, or commodity page on Investing.com and click ‘Analyze Chart’ button (as shown below).
Indicators for the Hunt: Choosing Your Momentum Tools
Hidden divergence relies entirely on comparing price movement to the momentum of an oscillator. To spot it, you need to choose reliable indicators that measure the speed and strength of price changes.
RSI MACD Divergence: The Best Tools for the Job
While several oscillators can be used, the two most popular and reliable tools for identifying hidden divergences in stock charts are the Relative Strength Index (RSI) and the Moving Average Convergence Divergence (MACD).
- Relative Strength Index (RSI): The RSI measures the magnitude of recent price changes to evaluate overbought or oversold conditions.
- Application: Look for RSI divergence when the price is in the 40 to 60 range, as this confirms the trend is consolidating in a healthy, neutral zone rather than reversing from an extreme.
- Moving Average Convergence Divergence (MACD): The MACD shows the relationship between two moving averages of an asset’s price, providing a momentum read.
- Application: Look for divergence using the MACD histogram, which provides a clear visual representation of the momentum’s intensity. Divergence that occurs while the MACD lines are above zero (for bullish) or below zero (for bearish) confirms alignment with the main trend.
By utilizing RSI MACD divergence in tandem, you introduce a layer of confirmation, making your signals significantly more robust.
Understanding the precise relationship between the price and the oscillator is the difference between profit and loss. We will use the technical terms Higher Lows (HL) and Lower Lows (LL) for accuracy.
Bullish Hidden Divergence (BHD) is the ultimate Trend Entry Optimizer for an uptrend. It signals that the current pullback in price is likely over and the uptrend is about to resume.
If from the Price Action chart, the price forms a Higher Low (HL), and from the RSI/MACD indicator forms a Lower Low (LL), the momentum is stronger than the price, which suggests confirming the dip is a healthy correction.
Practical Application: Imagine a stock soaring from $100 to $150, then pulling back to $140 (the first high low). It rallies to $160, then pulls back to $145 (the second high low). If, during that second pullback to $145, the RSI dips lower than it did during the first pullback to $140, you have a BHD. This is your cue to enter a long position, as the underlying buying strength is reloading for the next rally, despite the visual drop in the indicator.
Bearish Hidden Divergence (BHD) is the perfect signal to join or add to a downtrend. It confirms that the current rally is just a temporary bounce before the downtrend continues.
| Price Action (Chart) | Indicator Action (RSI/MACD) | Interpretation |
|---|---|---|
| Price forms a Lower High (LH) | Indicator forms a Higher High (HH) | Selling pressure is stronger than the price suggests, confirming the bounce is a temporary rally. |
Practical Application: In a severe downtrend, a stock falls to $50, rallies to $55 (the first lower high), and falls again to $40. It then attempts a second rally to $48 (the second lower high). If, during that second rally to $48, the RSI or MACD prints a higher reading than it did during the first rally to $55, you have a BHD. This signals a prime opportunity to enter a short position, as the selling pressure is consolidating its position.
A signal is useless without a rigorous plan. The hidden divergence trading strategy is a Confirmation Stack strategy, meaning you only trade when multiple factors align.
Maximize Profits: Validate Your Target Price with Fair Value 🎯
You’ve calculated your Risk/Reward target. But how do you know if the price is realistic
InvestingPro’s proprietary Fair Value models instantly calculate the objective intrinsic worth of the stock. Use this quantitative data to confirm your profit target is sound, or find the best institutional entry/exit levels.
Gain conviction and avoid leaving profit on the table.
Context is King: Always Check the Main Trend
This is the most critical rule: Hidden divergence is a trend continuation signal. It is irrelevant in a sideways, ranging market.
Before you draw a single line, ask yourself:
- Is there a clear trend? Are there consistent Higher Highs and Higher Lows (uptrend) or Lower Lows and Lower Highs (downtrend) on the daily or 4-hour chart?
- Is the divergence occurring at a point of value? The signal is strongest when the price pullback (the Higher Low or Lower High) hits a significant level of support or resistance, or a major moving average (e.g., the 50 or 200 period EMA). This fusion of a fundamental price level and a momentum signal creates a high probability setup.
Confirmation is Mandatory: Filtering False Signals
Hidden divergence gives you the “Why” and the “Where,” but you need a final confirmation for the “When” to avoid the false signal trap. Your Confirmation Stack should include waiting for a specific price action response:
- For Bullish Entry: Wait for a bullish candlestick reversal pattern (like a Hammer or Engulfing candle) right at the Higher Low point. The ideal trigger is a price close above the high of the previous candle.
- For Bearish Entry: Wait for a bearish candlestick reversal pattern (like a Shooting Star or Bearish Harami) right at the Lower High point. The ideal trigger is a price close below the low of the previous candle.
The Risk Management Playbook: Entry, Stop, and Target
The primary benefit of using hidden divergence is the opportunity for an excellent risk to reward ratio.
- Entry Point: Enter immediately upon confirmation of the candlestick reversal at the divergence point.
- Protective Stop Loss: Place the stop loss order just beyond the furthest swing point of the correction.
- For BHD (Long Entry): Place the stop loss slightly below the Lower Low of the price (the support level). This keeps your risk small.
- For BHD (Short Entry): Place the stop loss slightly above the Higher High of the price (the resistance level).
- Profit Target: Target the previous major swing high (for an uptrend) or major swing low (for a downtrend). A responsible strategy should aim for a minimum 1:2 risk to reward ratio.
Conclusion
Hidden divergence is a sophisticated but incredibly powerful tool for the discerning investor. It moves you past the basic “buy-low sell-high” mantra to the calculated precision of a trend continuation signal.
By comparing price movements (Higher Lows or Lower Highs) against the underlying momentum in your chosen oscillator, you gain a clear, low risk window to enter or add to a position with the high conviction that the market trend is still sound.
Remember the Confirmation Stack: establish the trend, identify the divergence, confirm at a key price level, and only enter upon a final candlestick trigger. By applying this disciplined hidden divergence trading strategy, you transform volatile pullbacks from a source of fear into your most reliable, high probability entry opportunity.
Start practicing today on your charts—the market is speaking, are you ready to listen?
Institutional-Grade Analysis, Immediate Results 🔎⏱️
The market moves fast, so make sure your insights move faster. Access WarrenAI’s instant technical analysis alongside the full suite of InvestingPro tools, including proprietary fair value calculations, financial health scores and AI-powered ProPicks.
Unlike other AIs that only analyze numbers, WarrenAI identifies visual patterns (candlestick formations, support levels, and trends) that make or break trades.
What WarrenAI Does Instantly: 🤖
🔎 Technical Summary: Provides a plain-language analysis of the current market structure, including trend, momentum, and key S/R levels.
⚠️ Risk Identification: Points out potential downside risks or failed signals the chart is flashing.
💡 Opportunity Spotlight: Highlights confirmed buy/sell signals based on institutional-grade algorithms, giving you a definitive edge.
🗺️ Trading Plan: Receive specific entry, stop-loss, and profit target prices based on technical analysis and risk/reward calculations that spot opportunities humans often miss.
Stop wasting time doing everything manually. Leverage WarrenAI to gain an instant edge to trade any market – across crypto, forex, commodities, stocks, ETFs and indices. Capture opportunities wherever they emerge, filtering hours of analysis into a concise, actionable report.
Don’t get left behind. Start your InvestingPro membership today.