As an individual investor, you already know the power of momentum indicators. Tools like the Relative Strength Index (RSI) and the Stochastic Oscillator are indispensable for judging whether a stock is overbought or oversold.
But if you’ve ever watched a trade go wrong because an “oversold” signal kept sinking, or an “overbought” signal kept rising, you’ve encountered the common enemy of all technical traders: the false signal.
Using an indicator in isolation is like trying to navigate with just one eye closed. You get a signal, but you lack depth and confirmation. The solution to filtering false signals and unlocking true trading precision lies in a powerful technique known as indicator confluence.
By learning how to combine RSI and Stochastic indicators, you create a sophisticated “Double Punch” system. This strategy leverages the unique mathematical strengths of both tools to validate trade setups, dramatically reducing noise and increasing the probability of a successful entry or exit. Ready to stop being whipsawed by the market? Let’s build a rock-solid RSI Stochastic strategy from the ground up.
Indicator Fundamentals: Speed vs Magnitude
While both the RSI and the Stochastic Oscillator are classified as momentum indicators and both use the 0 to 100 scale, they measure two fundamentally different aspects of price movement. Understanding this difference is the key to mastering their combination.
RSI: Measuring the Magnitude of Price Moves
The Relative Strength Index (RSI), developed by J. Welles Wilder Jr., measures the magnitude of recent price changes. It is calculated by comparing the average gain of recent periods to the average loss of recent periods.
- What it tells you: How strong the buyers are compared to the sellers over a specified lookback period (usually 14 periods).
- The Metaphor (Magnitude): Think of the RSI as measuring the size of the punches being thrown. Readings above 70 mean the bullish punches are much bigger than the bearish ones.
Stop Guessing: Chart RSI & Stochastic Like a Pro 📈
You need flawless accuracy to execute the Double Punch strategy. Don’t rely on slow, basic charts! Investing.com provides professional-grade charts with real-time data and the ability to seamlessly configure, layer, and track RSI and Stochastic simultaneously.
Investing.com’s exclusive WarrenAI tool cuts through the noise. Simply navigate to any stock, crypto, or commodity page on Investing.com and click ‘Analyze Chart’ button (as shown below).
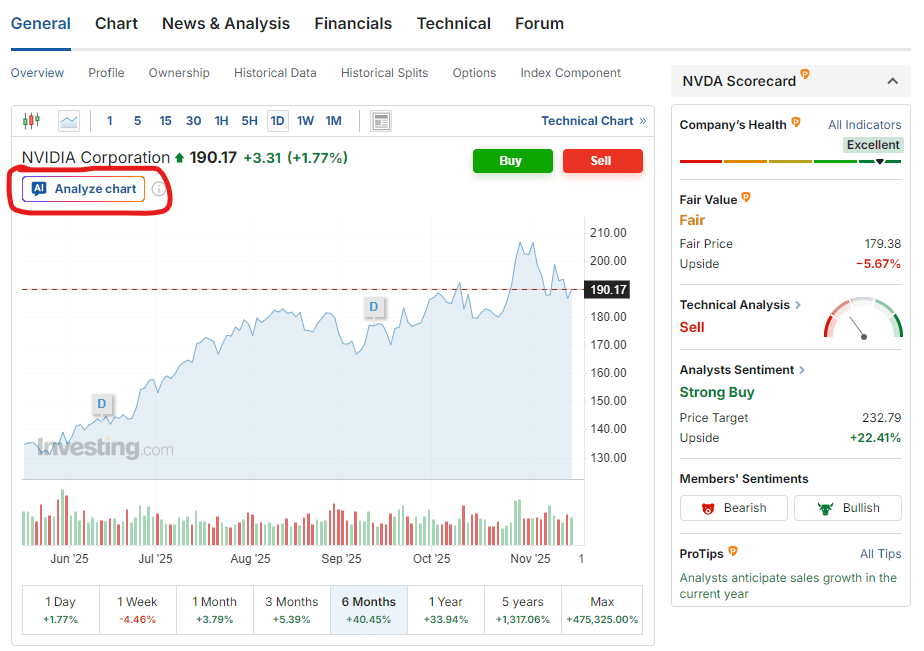
Get the clear, precise confluence visuals you need to confirm your entry, every time.
The Stochastic Oscillator: Measuring Price Closing Position (Speed)
The Stochastic Oscillator, developed by George C. Lane, measures the price’s speed or velocity. It compares the current closing price to its highest and lowest price range over a lookback period (usually 14 periods).
- What it tells you: Where the closing price is located within the recent high/low range. When the price consistently closes near the high of the range, it shows strong internal momentum, even if the price move itself is small.
- The Metaphor (Speed): Think of the Stochastic as measuring where the boxer lands their final punch relative to the corner of the ring. Readings above 80 mean the closing price is consistently near the daily high, indicating aggressive buying.
Because the Stochastic is highly sensitive to the closing price, it tends to react faster than the smoother RSI. This creates the perfect combination: RSI gives the context (magnitude), and Stochastic gives the precise timing (speed).
The Problem Solution: Filtering False Signals
The greatest limitation of any single oscillator is its tendency to flatline or remain in an extreme zone during a powerful trend. If a stock is soaring, the RSI can stay above 70 for weeks, and selling based purely on the “overbought” signal will cause you to miss significant gains.
The Double Punch Method: A Strategy for Confluence
The solution is the Double Punch Method, a strategy built on the principle of confluence. Confluence means we only take a signal when both indicators agree, simultaneously hitting their respective extreme zones and then crossing back. This provides a two layer confirmation, drastically filtering false signals.
The basic setup for the Double Punch signal is:
- RSI Alignment (The Setup): RSI hits the extreme zone (above 70 for sell, below 30 for buy), setting the overall stage.
- Stochastic Crossover (The Trigger): While RSI is in the extreme zone, the Stochastic’s faster line (%K) crosses its slower signal line (%D), triggering the exact moment for entry or exit. This signal is most powerful when the Stochastic crossover occurs near its own extreme lines (above 80 or below 20).
This method essentially uses the smoother RSI to confirm the overall market extremity, while using the faster Stochastic to pinpoint the high-precision turning point.
The RSI Stochastic Strategy for Trading Precision
To translate the Double Punch Method into an effective, low risk trading system, you must introduce the one element that determines success: The Trend Filter.
Step 1: Establish the Trend Context (The Trend Filter)
Before you search for any overbought oversold signals, you must know the prevailing trend on your higher timeframe (e.g., the daily chart for a swing trade).
- Rule: Use a 200 period simple or exponential moving average (SMA or EMA). If the price is above the 200 MA, you are in an uptrend, and you should only take Buy Signals. If the price is below the 200 MA, you are in a downtrend, and you should only take Sell Signals.
- Benefit: This mandatory trend filter protects you from the common mistake of buying against a major downtrend just because the indicators flash “oversold.”
Step 2: The Buy Signal Confluence (Oversold)
This setup is ideal for entering a pullback in an established uptrend (confirmed by the 200 MA).
- RSI Condition: Price is in an uptrend, and the RSI is below 30 (or moving up from below 30).
- Stochastic Condition: The Stochastic Oscillator is below 20, and the %K line crosses above the %D line.
- Entry Trigger: Enter the trade on the open of the candle immediately following the one that confirms the Stochastic crossover.
Step 3: The Sell Signal Confluence (Overbought)
This setup is ideal for exiting a position or entering a short trade in a confirmed downtrend.
- RSI Condition: Price is in a downtrend, and the RSI is above 70 (or moving down from above 70).
- Stochastic Condition: The Stochastic Oscillator is above 80, and the %K line crosses below the %D line.
- Exit Trigger: Exit the long position or enter a short trade on the open of the candle immediately following the one that confirms the Stochastic crossover.
The Ultimate Filter: Validate Your Trend with Financial Health Scores 🩺👩💻
Your 200 MA filter is good, but what if the company is fundamentally collapsing? Don’t take a bullish RSI/Stochastic signal against poor company health.
InvestingPro‘s Financial Health Score information instantly rates a stock’s underlying strength. Use this objective fundamental data to confirm your high-probability trend direction and avoid catastrophic trades.

Advanced Concepts and Risk Management
No RSI Stochastic strategy is complete without two key expert-level considerations: a faster indicator option and a rock solid risk control plan.
StochRSI: The Built in Combination
If manually tracking two separate indicators feels cumbersome, there is a dedicated tool called the Stochastic Relative Strength Index (StochRSI).
- How it works: StochRSI applies the Stochastic formula to the RSI values instead of the price itself. The result is an oscillator that is far more sensitive and volatile than both RSI and Stochastic.
- Expert Use: While it provides more signals, it also provides more false ones. It is best used for high frequency day trading or for scalping, but should be avoided by long term investors due to its extreme sensitivity.
Risk Control: Stop Loss and Profit Taking
The confidence that comes from trading precision should never lead to complacency. Risk management is non-negotiable.
- Stop Loss Placement: For a buy signal, place your protective stop loss slightly below the most recent swing low that preceded the Double Punch signal. For a sell signal, place it slightly above the most recent swing high. Your risk should always be small and predetermined.
- Profit Taking: Aim for a minimum 1:2 risk to reward ratio (risking one dollar to make two). Set your target at the next major area of support or resistance, or consider using a trailing stop to capture maximum gains once the trade is safely in profit.
Conclusion
Learning how to combine RSI and Stochastic indicators is a major step in your evolution as a trader. You move beyond single, often-misleading signals and into the world of indicator confluence, where confirmation is mandatory.
The RSI Stochastic strategy, when deployed with the Double Punch Method and filtered by a higher timeframe trend, transforms a choppy signal into a high probability setup.
The synergy between the RSI’s measure of magnitude and the Stochastic’s measure of speed gives you a superior edge for trading precision. Start by applying the three steps—establish the trend, confirm the confluence, and execute with a defined stop loss—on your favorite assets.
Trading is a game of probability, and with this powerful combination, you have significantly weighted the odds in your favor.
Institutional-Grade Analysis, Immediate Results 🔎⏱️
The market moves fast, so make sure your insights move faster. Access WarrenAI’s instant technical analysis alongside the full suite of InvestingPro tools, including proprietary fair value calculations, financial health scores and AI-powered ProPicks.
Unlike other AIs that only analyze numbers, WarrenAI identifies visual patterns (candlestick formations, support levels, and trends) that make or break trades.
What WarrenAI Does Instantly: 🤖
🔎 Technical Summary: Provides a plain-language analysis of the current market structure, including trend, momentum, and key S/R levels.
⚠️ Risk Identification: Points out potential downside risks or failed signals the chart is flashing.
💡 Opportunity Spotlight: Highlights confirmed buy/sell signals based on institutional-grade algorithms, giving you a definitive edge.
🗺️ Trading Plan: Receive specific entry, stop-loss, and profit target prices based on technical analysis and risk/reward calculations that spot opportunities humans often miss.
Stop wasting time doing everything manually. Leverage WarrenAI to gain an instant edge to trade any market – across crypto, forex, commodities, stocks, ETFs and indices. Capture opportunities wherever they emerge, filtering hours of analysis into a concise, actionable report.
Don’t get left behind. Start your InvestingPro membership today.