
Stock analysis can seem overwhelmingly complex, filled with confusing charts and hundreds of technical indicators. Yet, the core principles of successful trading boil down to one simple question: What is the current trend?
The good news is you don’t need a complex algorithm to answer that question. A handful of accessible, simple indicators for trading can provide clarity, turning a noisy price chart into a predictable roadmap. Think of these tools as your Market GPS: they show you where the stock is going, how fast it’s traveling, and when it’s running out of gas.
This step by step guide focuses on three non-negotiable indicators—Moving Averages (MA), the Relative Strength Index (RSI), and the Moving Average Convergence Divergence (MACD)—along with the indispensable power of volume.
We will show you how to use technical indicators not in isolation, but together, to confidently analyze stock trends, minimize false signals, and make disciplined investment decisions.
The Foundation: Reading the Language of Trends
Before applying any technical tool, you must first understand the visual language of the trend itself. A stock price rarely moves in a straight line; it moves in waves, making higher highs and higher lows in an uptrend, or lower highs and lower lows in a downtrend.
The Three Phases of Price Action
The core of trend analysis is classifying the stock’s current state:
- Uptrend (Bullish): Characterized by a rising price, with each successive high and low exceeding the previous one (Higher Highs and Higher Lows).
- Downtrend (Bearish): Characterized by a falling price, with each successive high and low being lower than the previous one (Lower Highs and Lower Lows).
- Sideways Trend (Consolidation/Ranging): Characterized by price trading within a defined horizontal channel, typically after a significant directional move. This is the market pausing to “refuel” before the next move.
Your goal as an investor is straightforward: to identify the current phase, join the trend early, and avoid getting caught when the trend reverses.
The Ultimate Time Saver: Analyze Any Chart in 1 Click 📊⏱️
You understand the complexity involved in manually cross-referencing trends, RSI, MACD, and volume. You even understand the top stock chart patterns and how to interpret their bullish or bearish meanings. But the financial markets move so fast that every minute spent manually analyzing a chart is an opportunity lost.
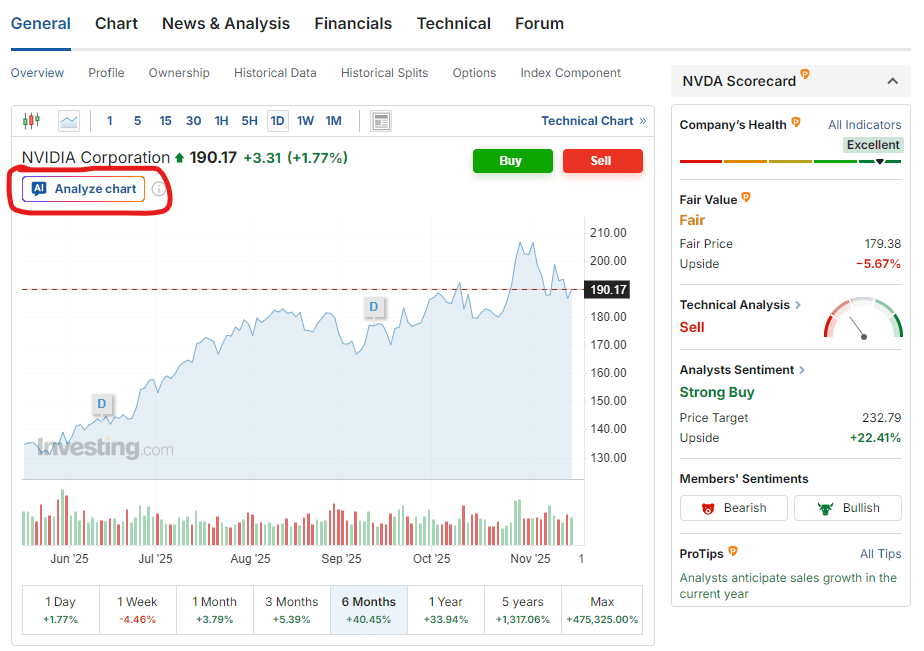
Investing.com’s exclusive WarrenAI tool cuts through the noise. Simply navigate to any stock, crypto, or commodity page on Investing.com and click ‘Analyze Chart’ button (as shown below).
Simple Indicators for Trading: The Trend Filter (Moving Averages)
The Moving Average (MA) is the simplest and most fundamental trend indicator. It smooths out price volatility by calculating the average closing price over a set period, revealing the true underlying direction of the price. If the MA is sloping up, the trend is up; if it’s sloping down, the trend is down.
The 200 Day MA: The Institutional Benchmark
The 200 day moving average (DMA) is the most widely watched MA in finance. Why? Because it represents the average price paid for the stock over the past year (approximately 200 trading days), making it the “institutional cost basis.”
- Uptrend Confirmation: When the stock price consistently trades above the 200 DMA, it confirms a strong, long term uptrend. The 200 DMA often acts as strong, dynamic support.
- Downtrend Confirmation: When the stock price consistently trades below the 200 DMA, it confirms a long term bearish trend. The 200 DMA acts as dynamic resistance.
The Golden and Death Cross: A Crossover Strategy
A highly popular moving average crossover strategy uses two MAs of different lengths (e.g., 50 day and 200 day) to generate clear buy or sell signals:
- Golden Cross (Bullish Signal): Occurs when the shorter term MA (e.g., 50 DMA) crosses above the longer term MA (200 DMA). This signals a major, long term bullish shift in momentum.
- Death Cross (Bearish Signal): Occurs when the shorter term MA (50 DMA) crosses below the longer term MA (200 DMA). This signals a major, long term bearish shift.
Practical Application: In an uptrend, you can use a shorter term MA (like the 20 day EMA) as a trailing stop or an entry point on a minor pullback. If the price temporarily drops to touch the 20 EMA and then bounces, it’s a sign the trend is healthy and momentum is continuing.
Stock Market Momentum Analysis: Gauging Speed and Strength
Moving Averages tell you where a stock is going. Momentum oscillators tell you how fast and how far it has run. This is essential for timing your entries and exits to avoid buying at the peak of excitement.
The Relative Strength Index (RSI): Spotting Overbought and Oversold
The Relative Strength Index (RSI) is a momentum oscillator that measures the speed and change of price movements. It oscillates between 0 and 100 and is primarily used to identify extreme price conditions.
- Overbought: An RSI reading above 70 suggests the stock has rallied too far, too fast, and is likely due for a pullback or consolidation. This is a potential signal to take profits or avoid entering a new long position.
- Oversold: An RSI reading below 30 suggests the stock has fallen too far, too fast, and may be poised for a bounce. This is a potential signal for a low risk entry into a long position (but only in the context of an overall uptrend).
Caution: In a very strong uptrend, the RSI can stay above 70 for long periods. Do not automatically sell just because the RSI is high; wait for the price to show signs of weakness or confirmation from another indicator.
Moving Average Convergence Divergence (MACD)
The Moving Average Convergence Divergence (MACD) is another powerful momentum indicator, designed to reveal changes in a stock’s strength, duration, and direction. It consists of three parts:
- MACD Line: The difference between the 12 period and 26 period Exponential Moving Averages (EMAs).
- Signal Line: A 9 period EMA of the MACD line.
- Histogram: The difference between the MACD Line and the Signal Line.
The most powerful signal in the RSI MACD strategy is the crossover:
- Bullish Crossover: The MACD line crosses above the Signal Line. This is a buy signal, indicating that short term momentum (the 12 EMA) is accelerating faster than medium term momentum (the 26 EMA).
- Bearish Crossover: The MACD line crosses below the Signal Line. This is a sell signal, indicating bearish momentum is taking control.
The Centerline: When the MACD lines are above zero, it confirms a strong bullish trend. When they cross below zero, it confirms a strong bearish trend.
The Confluence Rule: How to Combine Indicators and Volume
The biggest mistake new traders make is relying on a single signal, leading to the frustration of the “false signal.” The solution is confluence—waiting for multiple, non correlated signals to align before acting.
Volume: The Non Negotiable Confirmation
Volume represents the amount of interest or conviction behind a price move. It is the lifeblood of the market, and its inclusion is vital for every complete trend analysis.
- Confirming a Breakout: If a stock breaks above a resistance level (or the 50 DMA), the move is only trustworthy if it occurs on high volume (above average volume for that stock). High volume confirms that large institutions are participating.
- Warning of Weakness: If a stock makes a new high but does so on low volume, it is a warning sign. This divergence suggests the rally is being driven by little conviction and could reverse quickly.
Building Your Trading Checklist
To execute a confident, high probability trade, you must wait for a “Go” signal from multiple components of your Market GPS. Here is a simple checklist combining the simple indicators for trading:
| Component | Signal (Buy/Long) | Signal (Sell/Short) |
|---|---|---|
| Component | Signal (Buy/Long) | Signal (Sell/Short) |
| Trend (MA) | Price is above the 200 DMA. | Price is below the 200 DMA. |
| Timing (RSI) | RSI is crossing above 30 (oversold bounce) or bouncing off 50 (midline support). | RSI is crossing below 70 (overbought pullback) or falling below 50 (midline resistance). |
| Momentum (MACD) | MACD Line has crossed above the Signal Line. | MACD Line has crossed below the Signal Line. |
| Conviction (Volume) | Entry or breakout occurs on above average volume. | Exit or breakdown occurs on above average volume. |
The Confluence Rule in Action: A high-probability trade would be entering a stock that is
- above its 200 DMA
- has an RSI crossing above 30, and
- shows a bullish MACD crossover, all confirmed by a
- high volume spike.
Conclusion
Analyzing stock trends is less about prediction and more about discipline and process. By focusing on a few simple indicators—the MA for overall direction, the RSI and MACD for momentum and timing, and Volume for confirmation—you can cut through the noise of the market. You don’t need a complex trading system; you need a reliable checklist.
Remember, no single indicator is infallible. The true skill lies in recognizing confluence: aligning the directional signal from the 200 day moving average with the momentum signals from the RSI MACD strategy.
By committing to this methodical, rule based process, you replace emotional decision making with calculated strategy, giving yourself the best possible chance to capture profits and manage risk. Start practicing this checklist today on your favorite charts to confidently spot the next major trend.
Institutional-Grade Analysis, Immediate Results 🔎⏱️
The market moves fast, so make sure your insights move faster. Access WarrenAI’s instant technical analysis alongside the full suite of InvestingPro tools, including proprietary fair value calculations, financial health scores and AI-powered ProPicks.
Unlike other AIs that only analyze numbers, WarrenAI indentifies visual patterns (candlestick formations, support levels, and trends) that make or break trades.
What WarrenAI Does Instantly: 🤖
🔎 Technical Summary: Provides a plain-language analysis of the current market structure, including trend, momentum, and key S/R levels.
⚠️ Risk Identification: Points out potential downside risks or failed signals the chart is flashing.
💡 Opportunity Spotlight: Highlights confirmed buy/sell signals based on institutional-grade algorithms, giving you a definitive edge.
🗺️ Trading Plan: Receive specific entry, stop-loss, and profit target prices based on technical analysis and risk/reward calculations that spot opportunities humans often miss.
Stop wasting time doing everything manually. Leverage WarrenAI to gain an instant edge to trade any market – across crypto, forex, commodities, stocks, ETFs and indices. Capture opportunities wherever they emerge, filtering hours of analysis into a concise, actionable report. Don’t get left behind. Start your InvestingPro membership today.


